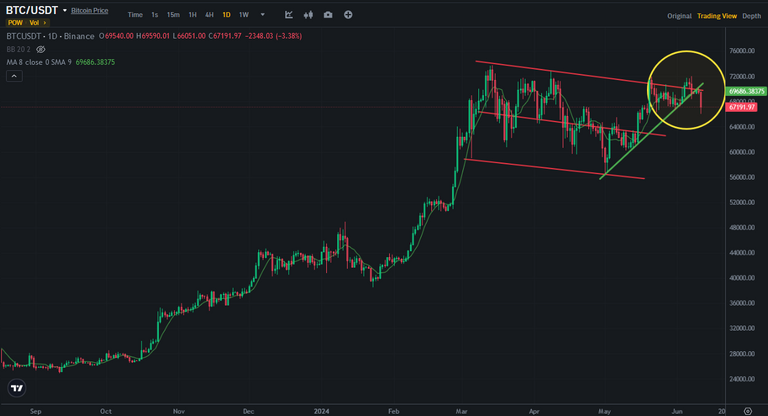
Bitcoin made lots of bullish traps. Bullish investors trapped by market maker. Lots of investors was waiting to see new all time high in June. Market maker trapped them and Bitcoin price broke down uptrend line.
Here you can see daily chart of Bitcoin. I shared this draft a few days ago and It worked very well. I said I would be out of market until to see breaking up or down. It happened and I saw breaking down on Bitcoin price chart.
There are a few bullish traps on Bitcoin price chart. Even Bitcoin broke up downtrend line and descending channel, they were only bullish traps..
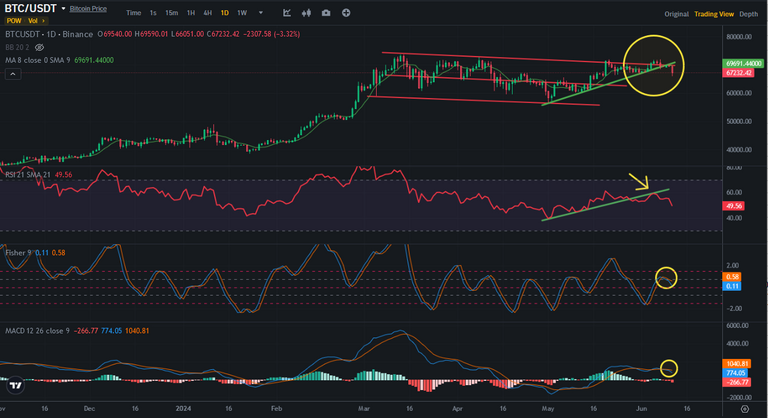
Here you can see the indicators on Bitcoin price chart. I drew an arrow to show you the retest on RSI Indicator to go down. It was great retest, uptrend line worked as a resistance on RSI Indicator. That is why Bitcoin price went down. It was very early signal and I am proud of sharing with you a few days ago.
Fisher and MACD Indicators reversed from the top and we may see price drop again. The middle line of descending channel is the first price target for Bitcoin price.
During Bitcoin price chart, lots of altcoins is going down fast. Hive may test price bottom. We will see..