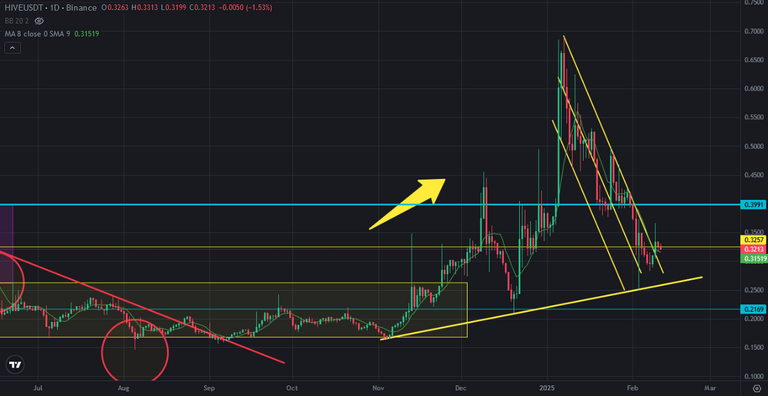
Hive price broke up downtrend line coming from 108K. Hive price was in descending channel for a month after touching 0,70 USD. It was going down for correction. During this time, all of altcoins are don 50% from the top. Hive orice broke up the top line of this descending channel. Here you can see daily chart of Hive. After breaking up this descengin channel, Hive has small red candles in daily chart. This is why Hive price may want to touch the downtrend line again to retest of bullrun. It may see healty for longterm bullrun on Hive price chart.
There is two great support on Hive price chart. The first one is downtrend line of the top line of descendinh channel. The second and great one is coming from the bottom. It is uptrend line on Hive price chart supported Hive price two times..
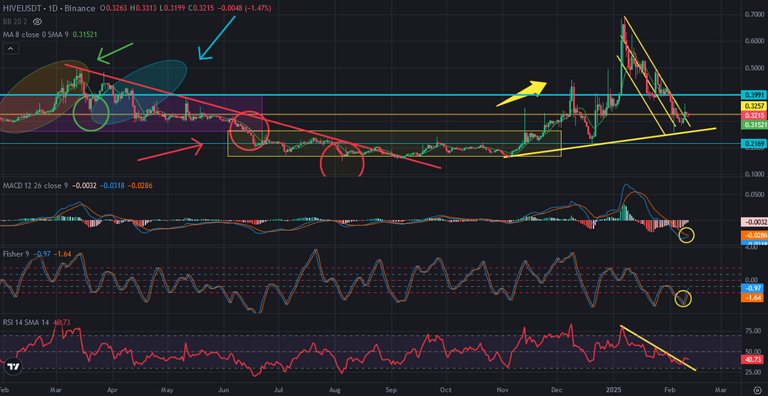
Here you can see the indicators on daily Hive price chart. All of indicators are bullish. RSI Indicator broke up the downtrend line. Fisher and MACD Indicators reversed from the bottom. It means Hive entered bullish trend in daily chart for short term. We may see Hive price pumps in a few days If market gives permission.
It may be possible to see the touch of this support line on Hive price chart If market waits for bullish run. It will not be a problem for us.
We will see..
Buy Hive at . 05. cents and sell at $1 …..
Wow that might have really been a very huge profit for you
Yeah … but then I also invested in some really bad projects and lost everything …. Like CUB on Leo Finance …. I Lost a small fortune on that one. You win some and sometimes you lose everything . I have learned some very hard lessons along the way. Bitcoin has been a very good investment…. And Blurt is the #1 best place to earn from Blogging and Curation.