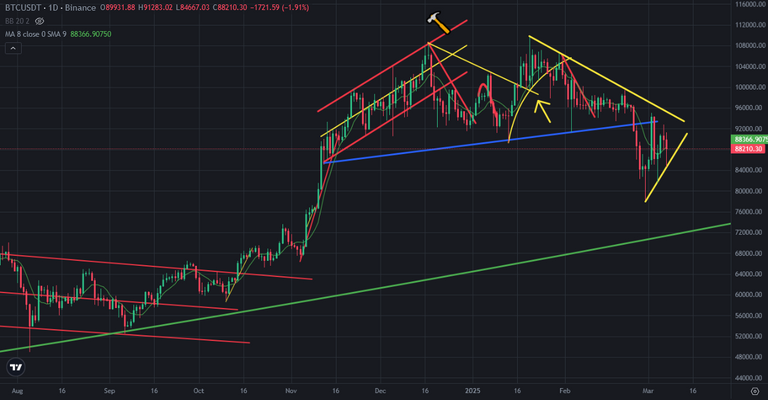
Big breaking up/down is coming on Bitcoin price chart. It is stuck between downtrend line and uptrend line. There was great downtrend line on Bitcoin price chart coming from 108K USD. There was great support line on Bitcoin price chart. After breaking down this great support line, Bitcoin price went down fast and made doji candles. There seemed uptrend line on Bitcoin price chart with these doji candles.
Here you can see daily chart of Bitcoin. Breaking up or down will happen in a few days. Uptrend and downtrend lines will be crossed in a few days.. Will it break up or down?
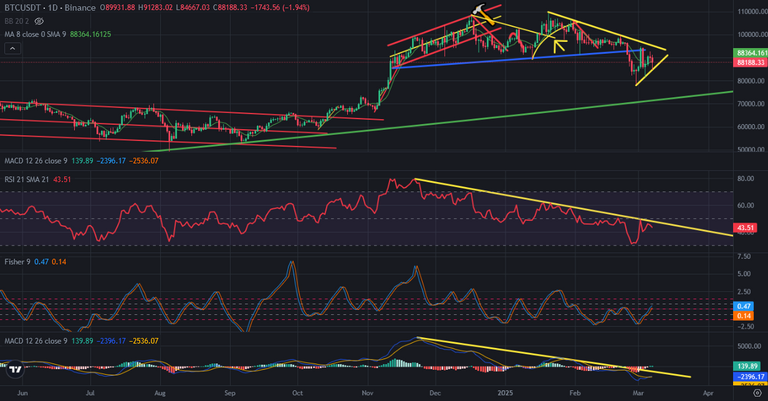
Here you can see the indicators on daily chart of Bitcoin. They will help us the predict breaking up or down.
There is downtrend line on MACD Indicator. It may be broken up in a few days. MACD Indicator reversed from the bottom. It may be time to break up downtrend line.
There is downtrend lineon RSI Indicator. It is tested three times before. After breakin up MACD Indicators resistance, RSI Indicator may break up this downtrend line.
So, Bitcoin price entered critical days. We will see breaking up or down. If Bitcoin price breaks down support line, we may see 7xK USD level.
It is good to see doji candles on Bitcoin price chart. I hope It will break up downtrend line..
We will see...