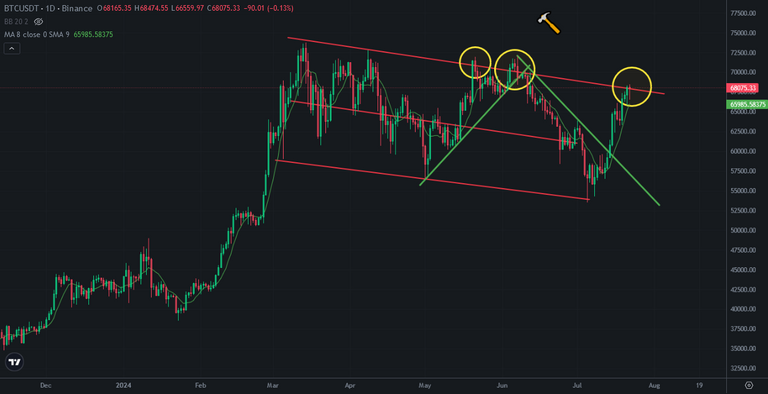
Bitcoin price touched the top line of descending channel coming from March. There were a few bullish traps on Bitcoin price chart, lots of investors are trapped. 72K was one of the great bullish traps. Yesterday Bitcoin price touched the top line of descending channel. Will it break up or make bullish trap again?
Here you can see daily chart of Bitcoin. You can see what I try to explain. Bitcoin price went up very fast from 55K to 68K. It is trying to break uo descending channel. Is it good time to break up? If it breaks up Bitcoin price will enter mega bullish trend. But There is no money to support this trend.
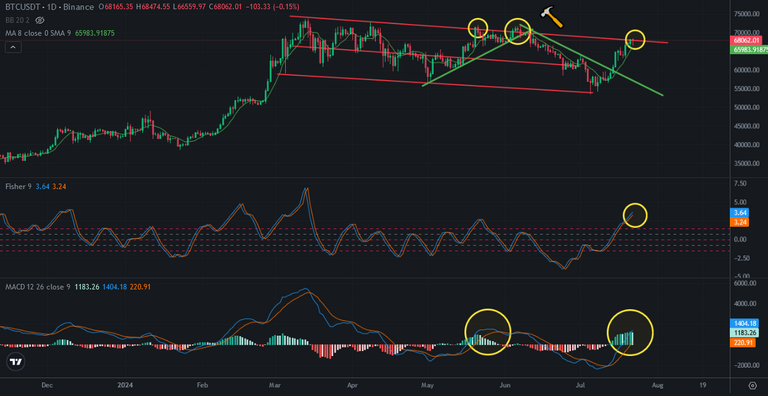
Here you can see the indicators of daily chart of Bitcoin. Fisher Indicator is on the top and needs to reverse. MACD Indicator is at same level as 72K bullish trap. We may see price drop in a few days and Bitcoin may make a new bullish trap again.
It may be early to break up this resistance and enter bullish trend.
I will be out of crypto market in a few days. I will watch the trend. I am waiting for price drop. I like this indicators and they tell me price drop today.
We will see..