Bitcoin price is going down fast. Nobody can predict where from Bitcoin will reverse up. Even it is going down fast, positive divergences started to seem on Bitcoin price chart. They are the signal of reversing.
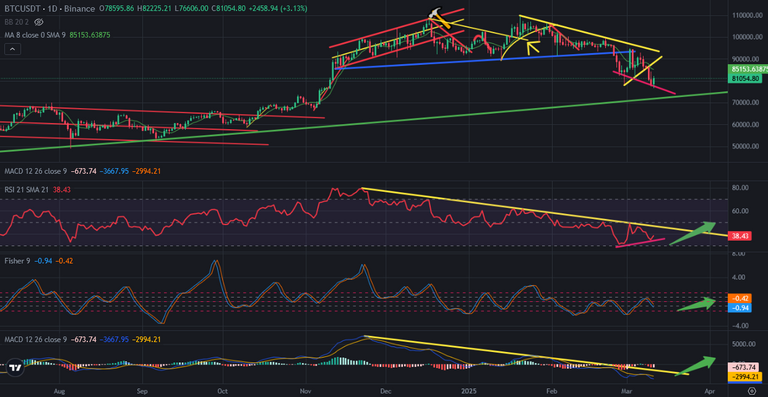
Here you can see daily chart of Bitcoin. There is positive divergence started on RSI Indicator. We may see green candles after seeing on Bitcoin price chart. If we see green candles on daily chart, RSI Indicator may break up downtrend line. MACD Indicator may break up downtrend line. Fisher Indicator may reverse up from the bottom. These will be the trigger for each other. Bitcoin price will enter bullish trend again.
End of March may be the time of reversing.
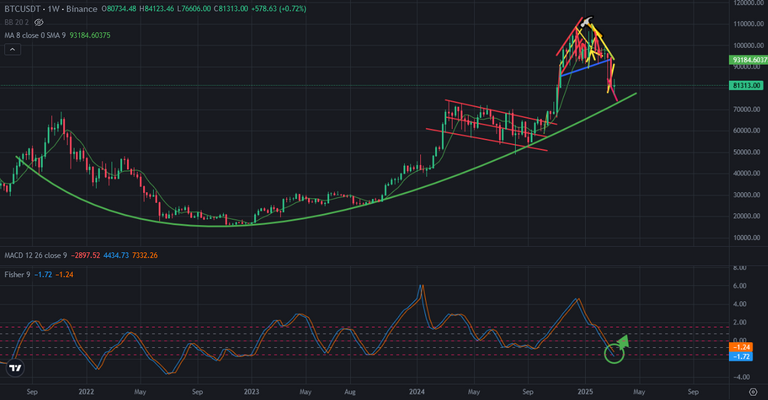
Here you can see weekly chart of Bitcoin. Fisher Indicator is on the bottom. If we see daily green candles as I said, Fisher Indicator will reverse up and Bitcoin price will enter bullish trend again in weekly chart.
If Bitcoin price reverses, triggers will work. We may enter bullish trend at the enf of March or at the beginning of April.
Even there is great support line on Bitcoin price chart, Bitcoin price may reverse without touching there. All of altcoins are on the bottom. It may be great level to pick up.
We will see...