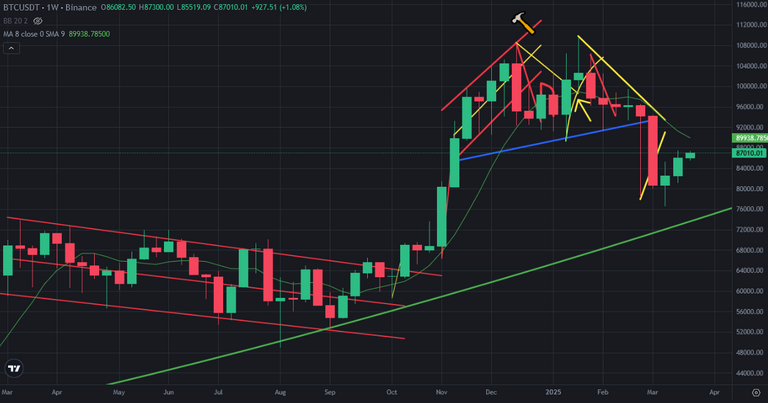
This is the first time that Bitcoin has 3 green weekly candle after touching all time high. Even we have seen 3 green weekly candles, Bitcoin price can not go up fast.
Here you can see weekly chart of Bitcoin. We have seen only 4 weekly green candles on Bitcoin price chart in a year. It was after US election with hype. So, we can not see more weekly green candles after 3 green series.. Will we see more green weekly candles after this week?
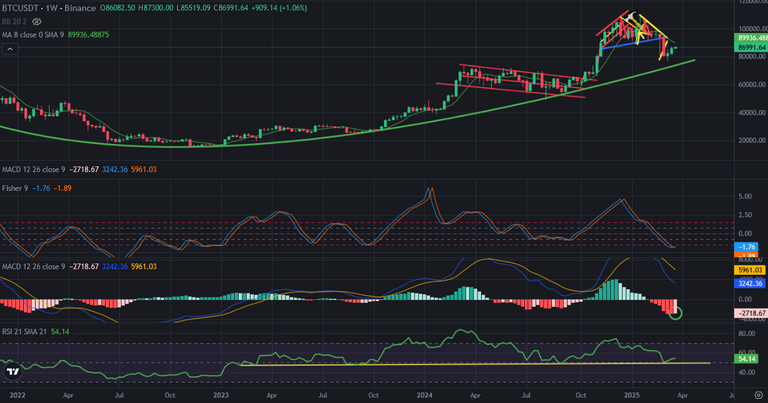
Here you can see the indicators on weekly chart of Bitcoin. MACD Indicators was on the sky and shoudl enter correction. MACD started to go up in this week. We need more weeks to reversing up on MACD Indicator in weekly chart.
Fisher Indicators is on the bottom and trying to reverse up. RSI Indicator is close to the bottom. There was great support line on RSI Indicator and It is supported by this great support line. So, we may see reversing up on the indicators on weekly chart.
The summary of this post is about the number of green candles of weekly chart. Even we may be close to end of green candle series, we may enter bullish trend in weekly chart.
So, Even we may see red weekly candle, we will enter bullish trend on weekly chart.
We will see..