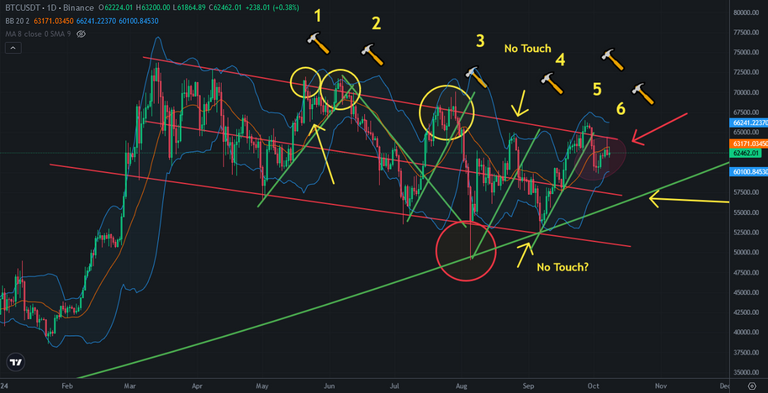
The middle line of Bollinger Bands resists Bitcoin price and Bitcoin can not go up above this resistance. It may be one of signal for downtrend. Bitcoin should touch bowl patterns support line and It is at 57K USD. This is the signal of price reversing. Bitcoin price may go down and touch the bottom line of Bollinger Bands.
Here you can see daily chart of Bitcoin and my draft shared a few months ago. Bitcoin price touched the top line of descending channel and could not break up. Even Bitcoin price broke up this resistance a few times before, these were only bullish traps. Yesterday Bitcoin price touched this resistance and went down. It may be time to go down on Bitcoin price chart to the price target which is at 57K USD!
Here you can see another bowl pattern on Bitcoin price chart on RSI Indicator. Bitcoin is close to break down this bowl pattern. When it happens we may see fast price drop to the target. There are great supports on 57K waiting for Bitcoin price.
8-day moving average is at 61700 USD level. When we see daily close below this level, we can be sure that Bitcoin price may go down to 57K USD..
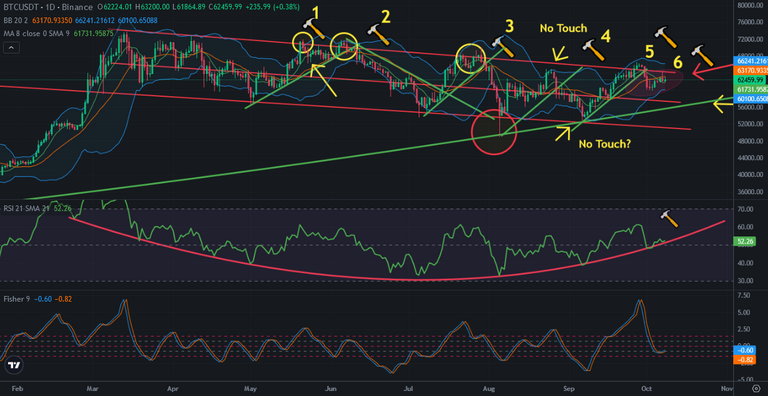
When we see lower bottom on RSI Indicator downtrend will start and we will wait the new pattern on RSI Indicator. We are at last days of this pattern.
We will see..
Posted Using InLeo Alpha