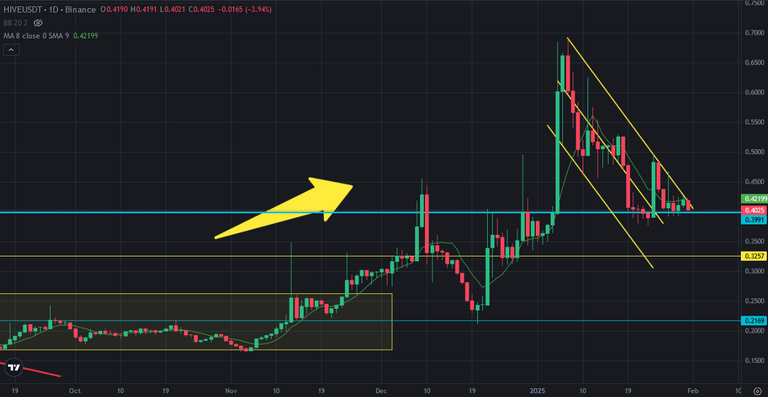
Hive price is in descending channel during price correction. Hive tried the tho line of this channel a few times but I can not. There is great support line oon Hive price chart at 0,40 USD. The downtrend line of descending channel and support line met at 0,40 USD. Hive price is at 0,40 USD. Hive will make a decision to break up or down 0,40 USD in a few days. We may see huge price pump or dump on Hive price chart.
Here you can see daily chart of Hive. Hive price is on 0,40 USD for a week. Sellers pressure is decreasing day by day. We may see breaking up the downtrend line on descending channel pattern.
Here you can see the indicators on Hive price chart. MACD Indicators was trying to reverse up. Fisher Indicator is at the begin of reversing down. So, we may see red candles in a few days in Hive price chart. If we see, MACD Indicator will continue to go down. We will see how 0,40 USD will support Hive price chart. It is important level for Hive price chart. Hive price should not break down this important support level.
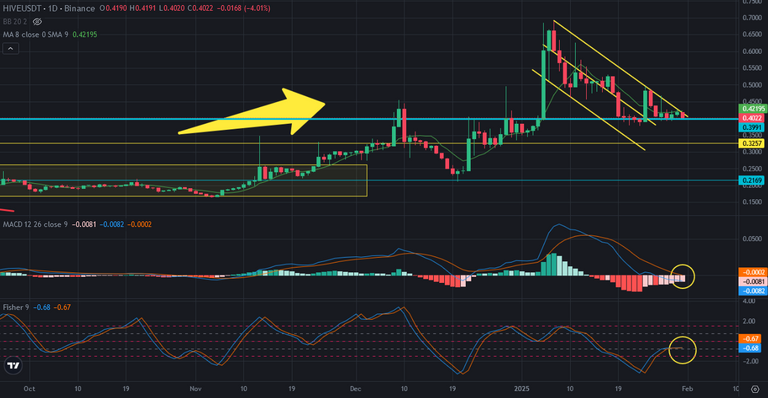
The range of Hive price chart is descreasing. We will see huge price moves on Hive price chart in a few days. I hope It will pump. If not, we will see Hive price at 0,33 USD..
We will see...