Bitcoin price met with great resistances and It is very hard to break up. Bitcoin is under price correction during a few month and It may take a long time.
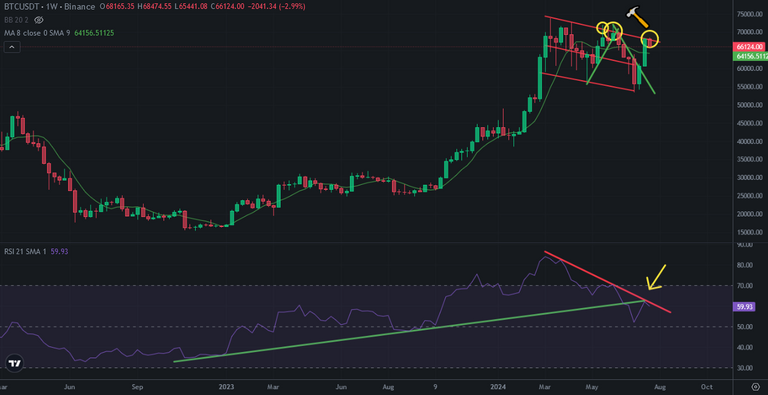
Here you can see weekly chart of Bitcoin. Bitcoin price is şn descending channel. There is uptrend line on RSI Indicator. It is broken down a fe weeks ago. It works as a resistance and It resistance RSI Indicator last week. Bitcoin should break up this resistance and make new pattern.
There is also a downtrend line on RSI Indicator. Bitcoin should break up this line to enter bullish season again. There is a cross of two resistances and It is very hard to break up. Bitcoin price may go down and to fill its bag with power to break up.
Here you can see monthly chart of Bitcoin. There is also downtrend line on monthly chart. Bitcoin should close this month above 62K. If it closes below this level, there will be pressure on RSI Indicator in monthly chart.
There is also similarty between past and now. You can see great downtrend line coming from 2021. You can see what happened after this line.
If Bitcoin price closes below 62K in this month, Downtrend may continue until end of 2024..
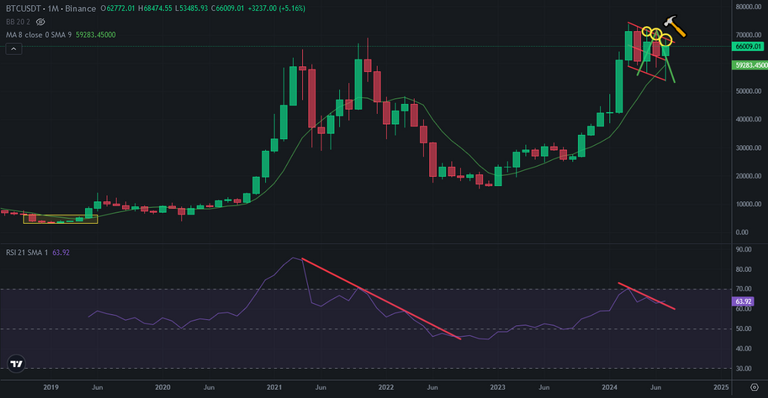
This month is so important. Bitcoin should close this month above 62K.
We will see..