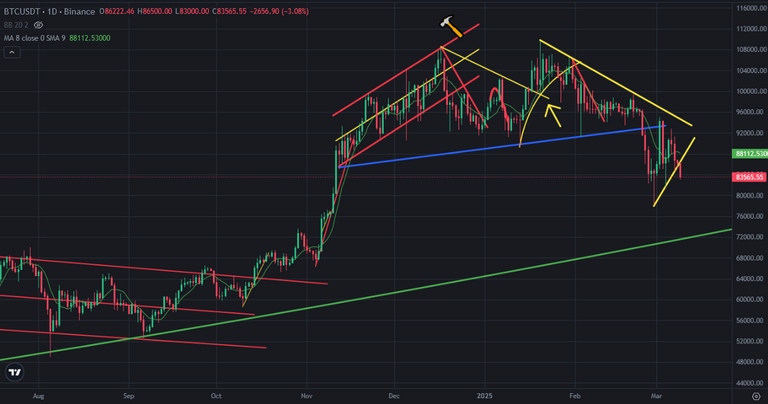
There was a mini uptrend line on Bitcoin price chart. It would be crossed with downtrend line coming from 108K USD. Today Bitcoin price broke down mini uptrend line. Price drop started again on Bitcoin price chart. 73K USD may be the target of price drop pn Bitcoin price chart.
Here you can see daily chart of Bitcoin and down and uptrend lines on this chart. Mini uptrend line supported Bitcoin price 3 times in short time. After breaking down mini uptrend line on Bitcoin price, we saw huge daily red candle..
There is great support line coming from 2023, it is at 73K USD. This is why I said price drop target may be 73K USD..
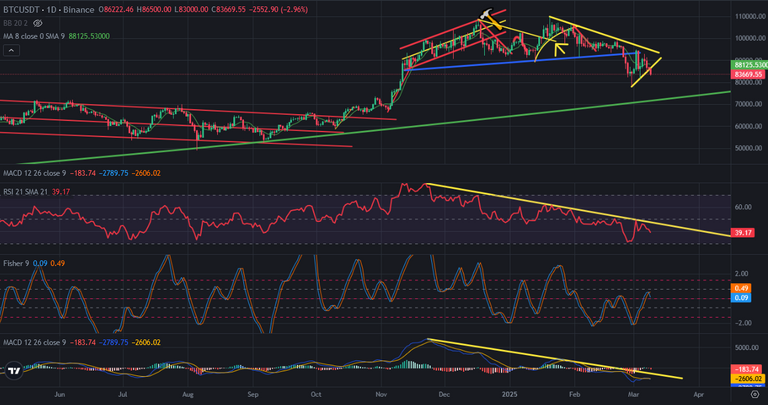
Here you can see the indicators on daily chart of Bitcoin. There are lots of downtrend lines on major indicators. MACD Indicator is trying to reverse up. When it reverses up, It will break up downtrend line. There is also downtrend line on RSI Indicator. When MACD Indicator reverses up, we may see breakin up on RSI Indicator.
Fisher Indicator shows us price correction will take time.
March will be bearish for Bitcoin price chart. But We will see price pump on April. Becasue breaking up will happen in April.
We are close to end of bearish season. We will see breaking up on resistances..
We will see..