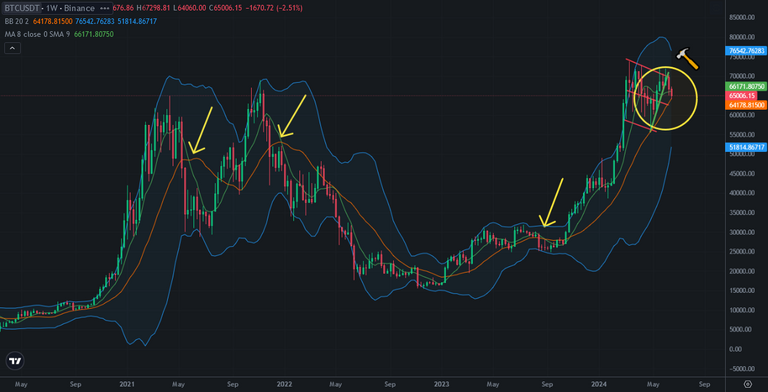
Bitcoin price is on critical support which is the middle line of Bollinger Bands in weekly chart. It is very important support for Bitcoin price that I don't imagine if Bitcoin breaks down this support line.
Here you can see weekly chart of Bitcoin and Bollinger Bands. I drew with the arrows the similarities between past and now. You can see what happened when Bitcoin price broke down the middle line of Bolllinger Bands in weekly chart.
It is so possible to see breaking down of the middle line of Bollinger Bands.
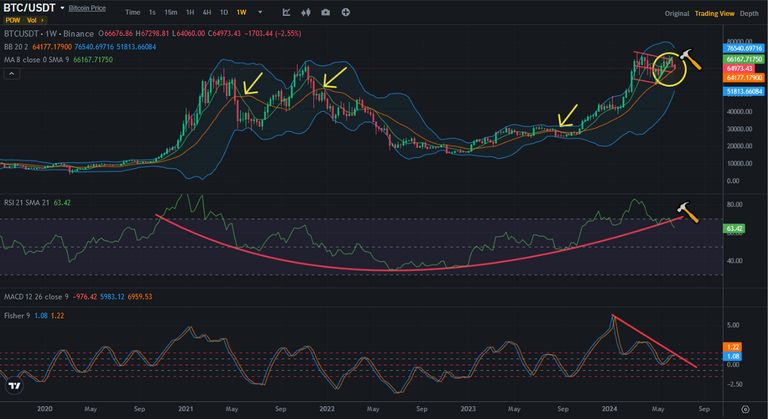
Here you can see the indicators on weekly chart of Bitcoin. This is why I said that it was so possible to see breaking down of the middle line of Bollinger Bands.
There is bowl pattern on RSI Indicator. It is broken down. I shared lots of analysis and showed you that RSI Indicator is great signal for future. It means, price will break down the bowl. It means, Bitcoin price will break down the middle line of Bollinger Bands.
So, it is very possible to see price drop on Bitcoin price chart in a few week. Bitcoin price went down more than 10% in a week when it broke down the middle line of Bollinger Bands in September. It is hardly possible to see same scenario. We may see Bitcoin price again in 5xK level.
I am waiting with my cash. If this price drop happens, lots of altcoin will go down more than 20%. I will pick up them and Hive.
We will see...