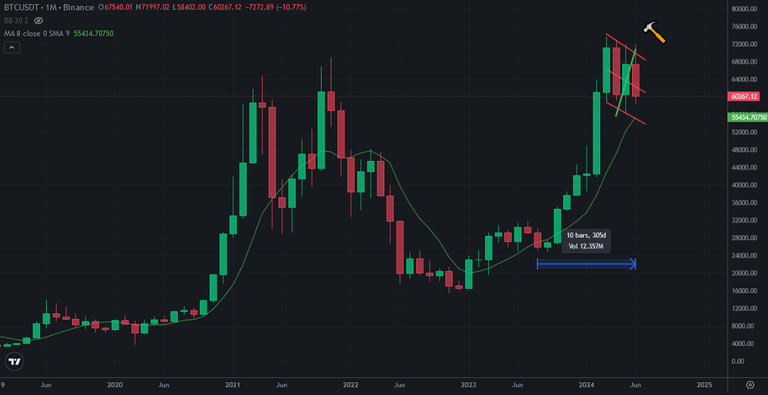
End of month is coming soon. This is 2nd red monthly candle in last 10 Months at Bitcoin price chart. June started with green candle. I shared an analysis for Bitcoin price chart and Red candle is so possible to see in June. Because It would be 9th green candle in last 10 months. It is going as impossible.
Even we saw 2 red monthly candles in last 3 months, It may continue to see more red candles. Bitcoin did need price correction. It may take long time.
Here you can see monthy chart of Bitcoin. 8-month moving average is still far away from price. We saw it in 2019 and It took long time. We should see the meeting of 8-month moving average and price.
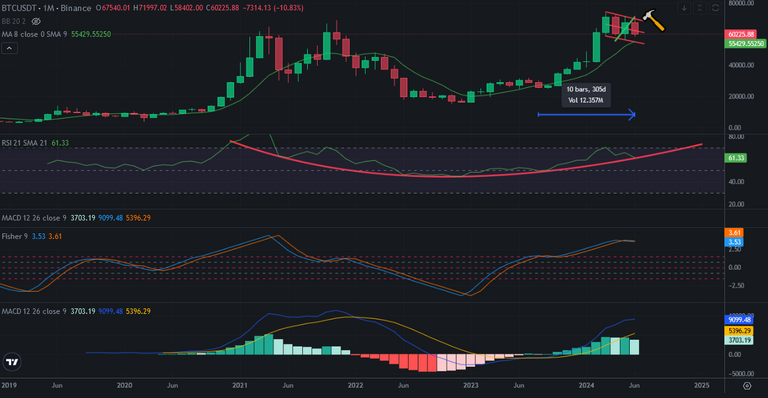
Here you can see the indicators on monthly Bitcoin price chart. Fisher Indicator was on the top. When lots of investors was waiting for new all time high, I said that we would enter price correction. We should see decreasing of Fisher Indicator on monthly chart. We need more months.
There is a bowl pattern on RSI Indicator. We should follow this pattern. I shared weekly price analysis for Bitcoin chart. There was a bowl pattern on RSI Indicator and It is broken down now.
It is possible to see on monthly RSI Indicator. We may see huge price drops if it happens..
I am waiting to see 52K USD for Bitcoin price. We are still at the beginning of price correction period.
We will see..