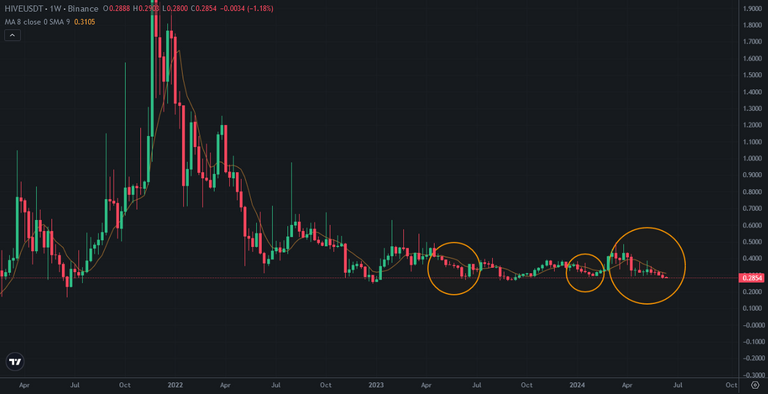
Hive has 5 red weekly candle in last 5 weeks. Hive has entered downtrend at the beginning of April and we have seen lots of green candles. 5 weekly red candles series is one of the longest series for Hive. After these red weekly series, Hive price went up as before.
Here you can see weekly chart of Hive and you can see what happened after weekly red candles series.
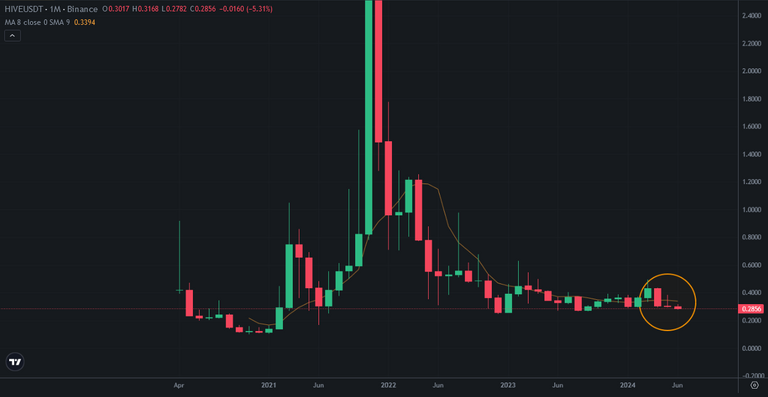
Here you can see monthly chart of Hive and you can see 3 monthly red candle series. 4 monthly red candles is the record for Hive price chart and we have seen lots of reversing after 3 red candles. We may see green candle in Hive price chart Hive would complete red candle in this month..
Hive price is on the bottom and we may see reversing on Hive price chart.
It is great chance to pick up Hive in discounted price. We are close to reversing on Hive price chart.
We will see..