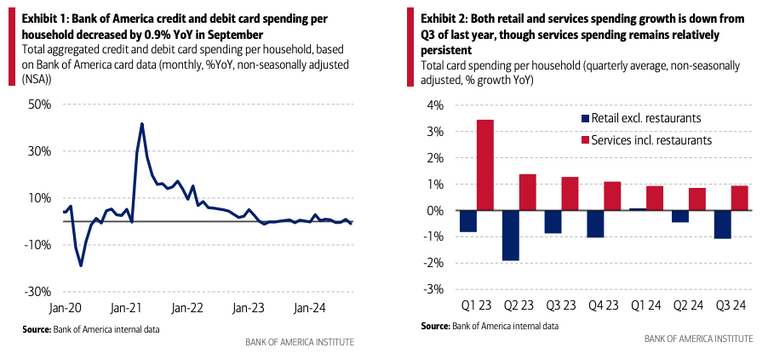
In the ever-shifting landscape of economic indicators, retail sales data has become a focal point for investors trying to gauge the health of the U.S. economy. Recent reports have painted a complex picture, with surprising upswings and potential data quirks that demand a closer look. Let's unpack the latest trends and what they might mean for your investment strategy.

Consumer Checkpoint October 2024, Bank of America
The Unexpected September Surge
September's retail sales data caught many analysts off guard, showing a robust 0.7% increase from August. This surge wasn't just a one-off; it came with upward revisions to July and August figures, painting a picture of a more resilient consumer than previously thought.
Key takeaways:
- September sales rose 0.7%, beating expectations of 0.3%
- August numbers revised up to 0.8% growth
- July figures also adjusted upward to 0.6%
This trifecta of strong numbers suggests that the U.S. consumer might have more gas in the tank than many believed. But before we pop the champagne, let's dive deeper into what's really going on.
The Seasonal Adjustment Conundrum
Here's where things get tricky. The Census Bureau uses seasonal adjustments to smooth out predictable fluctuations in the data. However, there's growing concern that these adjustments might be painting an overly rosy picture.
Consider this: While the seasonally adjusted numbers showed growth, the raw data tells a different story. In January 2023, for instance, retailers actually saw a 16% drop in sales compared to December – a stark contrast to the reported 3% surge after seasonal adjustments.
Why the discrepancy? Some economists suggest that pandemic-induced changes in consumer behavior may have thrown off the traditional seasonal patterns. If people are spreading their holiday shopping across more months, for example, the usual December spike (and January drop) might be less pronounced.
Reading Between the Lines
So, how should investors interpret this data? Here are a few key points to consider:
Look at longer-term trends: Three-month and twelve-month growth rates may provide a more accurate picture than volatile monthly figures.
Consider inflation: While nominal sales are up, it's crucial to factor in inflation. Real (inflation-adjusted) growth gives a clearer picture of consumer spending power.
Watch sector variations: Not all retail sectors are performing equally. Online retailers (non-store) continue to outperform, while some brick-and-mortar segments lag.
Keep an eye on revisions: As we've seen, initial reports can be significantly revised in subsequent months.
Implications for Investors
The stronger-than-expected retail sales data has several potential implications:
Fed Policy: Robust consumer spending could encourage the Federal Reserve to maintain higher interest rates for longer, impacting bond yields and borrowing costs.
Sector Performance: Consumer discretionary stocks might benefit from continued strong spending, but be wary of potential overvaluation.
Economic Outlook: While strong retail sales suggest economic resilience, they also raise questions about the sustainability of consumer spending given high debt levels and dwindling savings.
Looking Ahead
As we move into the crucial holiday shopping season, investors should keep a close eye on several factors:
- The impact of rising credit card balances on future spending
- Potential shifts in consumer behavior due to economic uncertainties
- The performance of different retail sectors, particularly the growing divide between online and traditional retailers
Remember, retail sales data is just one piece of the economic puzzle. It's essential to consider it alongside other indicators like employment figures, inflation data, and broader economic trends.
In this complex economic environment, staying informed and maintaining a diversified portfolio remains crucial. While the resilience of the U.S. consumer has continually surprised analysts, it's wise to approach these figures with a balanced perspective, considering both the opportunities and risks they present.