Bollinger Bands are a versatile and widely-used technical analysis tool that can provide valuable insights for both cryptocurrency and stock traders. Developed by John Bollinger in the 1980s, this indicator has become a staple in many traders' arsenals. Let's explore what Bollinger Bands are, how to use them effectively, and their strengths and weaknesses.
 Bollinger Bands
What Are Bollinger Bands?
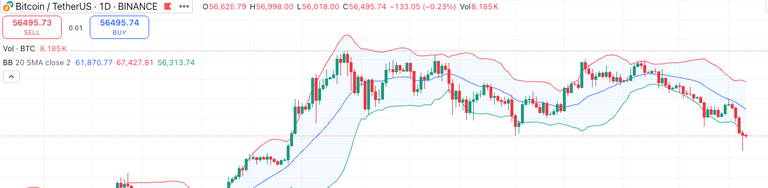
Bollinger Bands consist of three lines plotted on a price chart:
- The middle band: A simple moving average (SMA), typically using a 20-day period.
- The upper band: Set two standard deviations above the middle band.
- The lower band: Set two standard deviations below the middle band.
These bands expand and contract based on market volatility, providing traders with insights into price trends and potential reversal points.
How to Use Bollinger Bands
Bollinger Bands can be utilized in several ways:
1. Identifying Overbought/Oversold Conditions
- When prices touch or exceed the upper band, it may indicate overbought conditions.
- When prices touch or fall below the lower band, it may suggest oversold conditions.
2. Trend Identification
- The direction of the middle band can indicate the overall trend.
- An upward-sloping middle band suggests an uptrend.
- A downward-sloping middle band indicates a downtrend.
3. Volatility Measurement
- The width of the bands reflects market volatility.
- Wider bands indicate higher volatility.
- Narrower bands suggest lower volatility.
4. Breakout Detection
- A significant price move outside the bands may signal a potential breakout and the start of a new trend.
Practical Strategies for Crypto and Stock Trading
Bollinger Bounce Strategy
This strategy is based on the principle that prices tend to return to the middle band after touching the upper or lower bands.
Setup: Use the standard 20-period SMA with 2 standard deviations for the bands.
Execution:
- Buy when the price touches the lower band and sell when it reaches the middle band.
- Sell when the price touches the upper band and buy back when it returns to the middle band.
Best for: Range-bound markets
Bollinger Squeeze Strategy
This strategy identifies potential breakouts by looking for periods of low volatility followed by a significant price move.
Setup: Use a longer period (e.g., 50-day SMA) with 2.5 standard deviations to identify major trend changes.
Execution:
- Look for periods when the bands narrow significantly (the "squeeze").
- Enter a trade in the direction of the breakout when price moves outside the bands.
Best for: Identifying potential trend reversals or breakouts
Trend Following with Bollinger Bands
Use Bollinger Bands in conjunction with other trend indicators to confirm the strength and direction of trends.
Setup: Combine Bollinger Bands (20-period SMA, 2 standard deviations) with a longer-term moving average (e.g., 50-day or 200-day) for trend confirmation.
Execution:
- Enter long positions when price is above both the middle Bollinger Band and the long-term moving average.
- Enter short positions when price is below both the middle Bollinger Band and the long-term moving average.
Strengths of Bollinger Bands
- Adaptability to market volatility
- Visual representation of relative price levels
- Versatility in various market conditions
- Compatibility with other technical indicators
Weaknesses of Bollinger Bands
- Lag due to the use of moving averages
- Potential for false signals, especially in choppy markets
- Subjectivity in interpretation
- Limited effectiveness as a standalone indicator
Overcoming Weaknesses
To make up for the weaknesses of Bollinger Bands, consider the following:
Combine with other indicators: Use Bollinger Bands in conjunction with momentum oscillators (e.g., RSI, MACD) or volume indicators for confirmation.
Multiple timeframe analysis: Analyze Bollinger Bands across different timeframes to gain a more comprehensive market view.
Wait for confirmation: Don't act solely on price touching the bands; wait for additional confirmation, such as candlestick patterns or support/resistance levels.
Adjust parameters: Customize the period and standard deviation settings based on the specific asset and market conditions. For example, use shorter periods for more volatile assets or longer periods for long-term trend analysis.
Consider overall market context: Always interpret Bollinger Bands signals within the broader market context, including fundamental factors and overall trend direction.
Bollinger Bands are a powerful and versatile tool for traders and investors in both crypto and stock markets. By understanding their strengths and weaknesses and combining them with other analytical methods, traders can enhance their decision-making process and potentially improve their trading results.
Remember, no single indicator is foolproof, and proper risk management should always be employed in trading and investment strategies. Use Bollinger Bands as part of a comprehensive trading plan, and continually refine your approach based on market conditions and your own trading style.