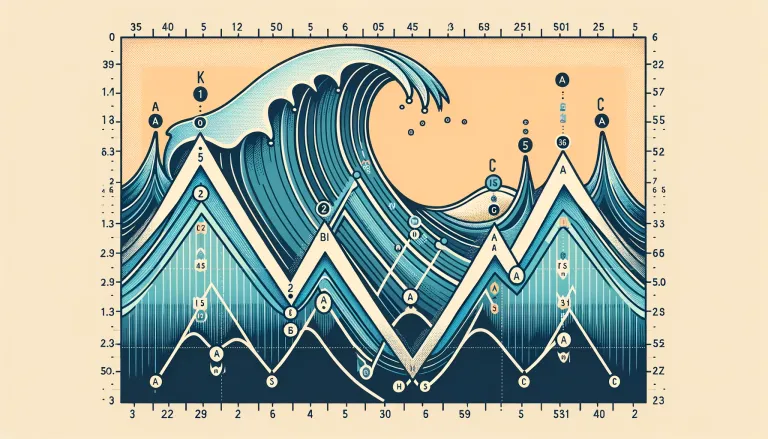
Navigating the turbulent seas of the cryptocurrency market requires more than just luck; it demands an understanding of the underlying currents that drive price movements.
One such current I've experienced is the Elliott Wave Theory, a fascinating tool that I believe offers some insights into market psychology and potential future trends.

Riding the Waves of Investor Psychology
The Elliott Wave Theory is rooted in the belief that investor behavior, driven by collective psychology, moves in repetitive cycles.
These cycles are composed of a series of waves that I've found can often predict market trends with surprising accuracy. The theory typically identifies a pattern of five 'impulse' waves followed by three 'corrective' waves. Each impulse wave represents a movement in the direction of the trend, while corrective waves move against it.
Real-World Examples of Elliott Waves
To illustrate the Elliott Wave Theory's practical application, consider the cryptocurrency boom of late 2017. Here, we observed a classic five-wave impulse pattern as Bitcoin soared to unprecedented heights. What followed was an inevitable corrective phase—a stark reminder of the ebb and flow dictated by the waves of market sentiment.
Another example could be the stock market's response to global events. The initial shock of a crisis often triggers a sharp decline, aligning with the theory's prediction of a 'wave one' descent. Subsequent waves of recovery and adjustment then play out as markets assimilate new information and investor sentiment shifts.
The Power of Confluence in Elliott Wave Analysis
When employing the Elliott Wave Theory, I pay close attention to 'confluence zones.' These are areas on a chart where multiple technical indicators converge, suggesting a stronger likelihood of a significant price movement. For instance, if a 'wave three' peak coincides with a key Fibonacci retracement level, it could reinforce the potential for a robust upward trend.
Market Corrections and Complex Patterns
The corrective phases of the Elliott Wave sequence, denoted by letters like WXY, can be intricate and multifaceted. These corrective patterns often signal market consolidation or distribution, providing clues for potential reversal points. For instance, after a bullish impulse wave, a complex WXY correction could suggest a period of market indecision before the next significant trend emerges.
Embracing Market Rhythms
My exploration of the Elliott Wave Theory has convinced me that the markets speak in rhythms and patterns. By understanding and interpreting these patterns, we can better position ourselves to ride the waves of market trends, rather than being caught in the undertow. It's about harmonizing with the market's tempo, being patient during corrections, and ready to act when the next impulse wave begins.
The Elliott Wave Theory is not just a technical tool—it's a lens through which we can view the financial markets, offering a unique perspective on the human emotions and decisions that drive them.