
(Charts by TradingView)
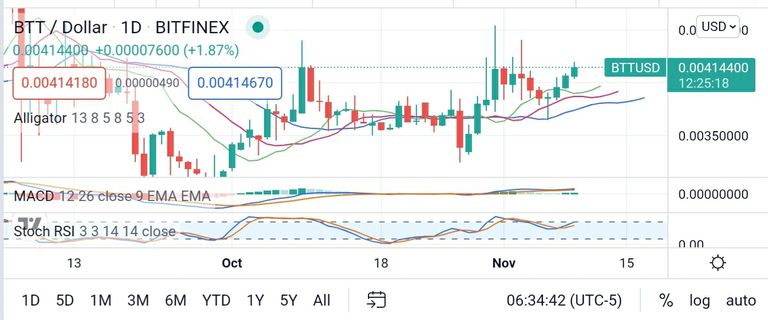
As of late September, the BitTorrent alligator was down to around ¢0.35. But then rose again until mid-October then fell asleep. Then since the beginning of November it rose again rapidly to this day.
Meanwhile, the MACD (Moving Average Convergence Divergence) oscillator seems to be in a bullish position. This implies that the price of this asset is still increasing.
On the other hand, the Stochastic RSI (Relative Strength Index) oscillator seems to be moving from the neutral area to the overbought area. This indicates that the market price of this asset is increasing beyond its intrinsic price.
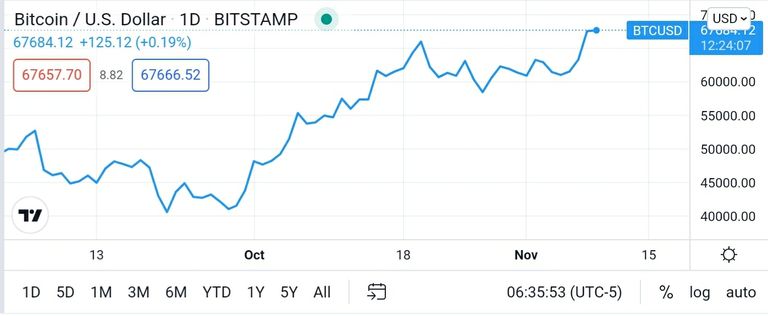
While in the chart below, we see the price of bitcoin is soaring and reached new ATH again. And usually the ups and downs of bitcoin prices will be followed by the prices of other altcoins.
At this time, the alligator's mouth is wide open pointing upwards. Will it rise again even faster?
Let's continue following this BitTorrent alligator adventure.
Thank you for using my upvote tool 🙂

Your post has been upvoted (24.83 %)
Delegate more BP for better support and daily BLURT reward 😉
@tomoyan
https://blurtblock.herokuapp.com/blurt/upvote