
(Charts by TradingView)
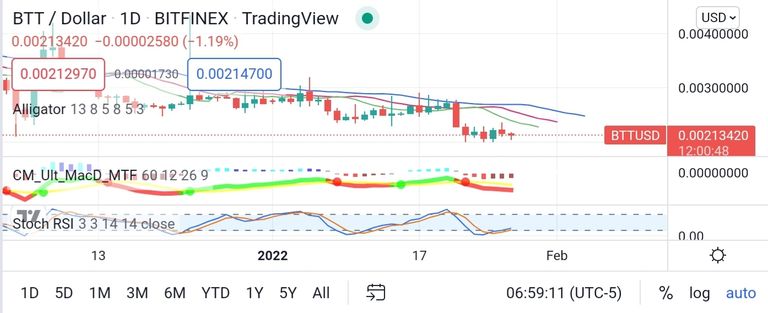
As of mid-December, the BitTorrent alligator appeared to be sleeping below ¢0.35. Then it fell slowly to above ¢0.25 in mid-January, and suddenly fell until it briefly dropped below ¢0.2.
Currently the MACD (Moving Average Convergence Divergence) oscillator is in a bearish position. This means that the price of this asset is falling.
Meanwhile, the Stochastic RSI (Relative Strength Index) oscillator seems to be in the oversold area. This indicates that the market price of this asset is below what it should be.
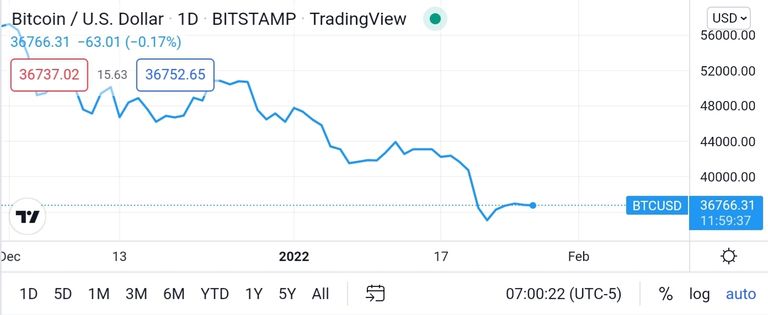
On the other hand, in the chart below, we can see that the price of Bitcoin is falling. And usually, Bitcoin price fluctuations are followed by all other altcoins.
At this point, the alligator's mouth looks wide open downward and shows no signs of closing. Is it still going down?
Let's continue to follow this BitTorrent alligator adventure.