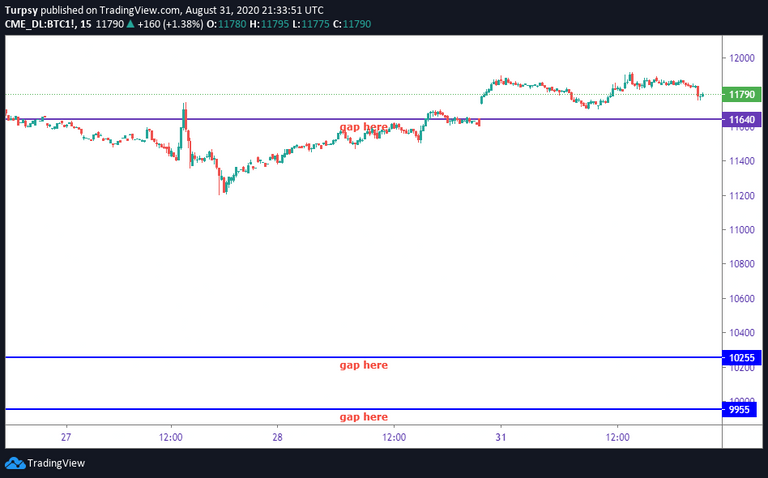
The gap at 11640 was filled beacause of the CME market close during the weekend. This means we may likely fill this gap in the coming days. Therefore we should have it at the back of our mind in the coming days.
11640- Not yet
10255, -Not yet
9955, -Not yet
9215 -Not yet
8840 USD. - Not yet
https://www.tradingview.com/x/zvMOQVXx/
This is my entry for the 100DAYSOFTA challenge, Tuesday 25th August 2020.
__
I am joining a challenge by a group of traders. The challenge is #100DAYSOFTA. Some of the people in this group have posted on $Youtube, $Twitter but I will be posting mine on Hive.
The convener of this challenge is https://twitter.com/CryptoluXP
However, the frequency might not be daily but it will be sequential.
Having said that, here is what I have:
__
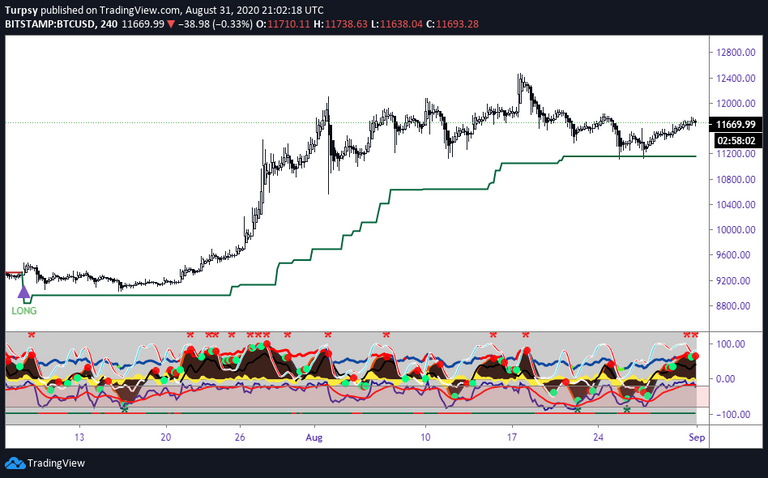
4 hr
The easiest way to trade BTC is to use the 4hr TF for support and resistance. We can see that this has acted as a good support for all these dump. We have not broken the trend downward in this trend. As the support of the ST has been strong enough hold the price. This means we can count on this TF, and trade accordingly if the we see a change in the trend. Right now we can see the Willy as overbought Also, the wave trend also shows a red dot. This means we may see a drop in the BTC chart in the short term.
https://www.tradingview.com/x/3aaa6Te0/
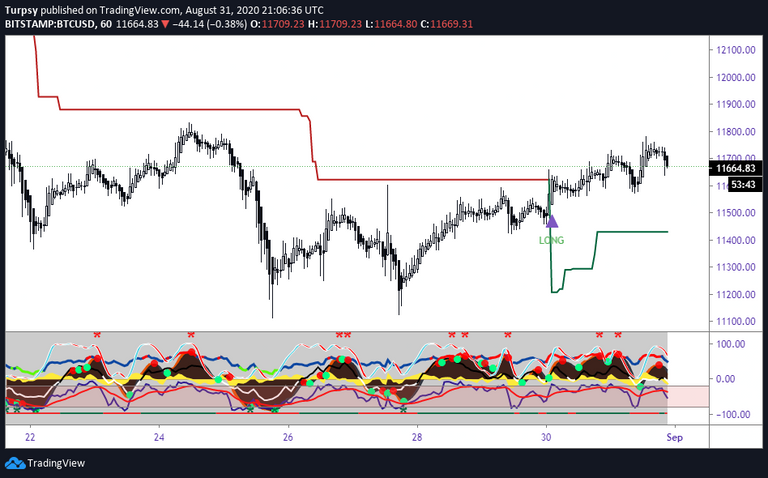
1h
On this TF we have the ST having a support at lower price around 11450 USD. This shows that if the price drops we may get supported at that level and that should be almost close to the previous double bottom we had earlier. As we can see now, the Willy is showing that we may have a drop in the price and that cautious is needed. Also, we can see the red dot on the wavetrend indicator.
https://www.tradingview.com/x/QxN98U7l/
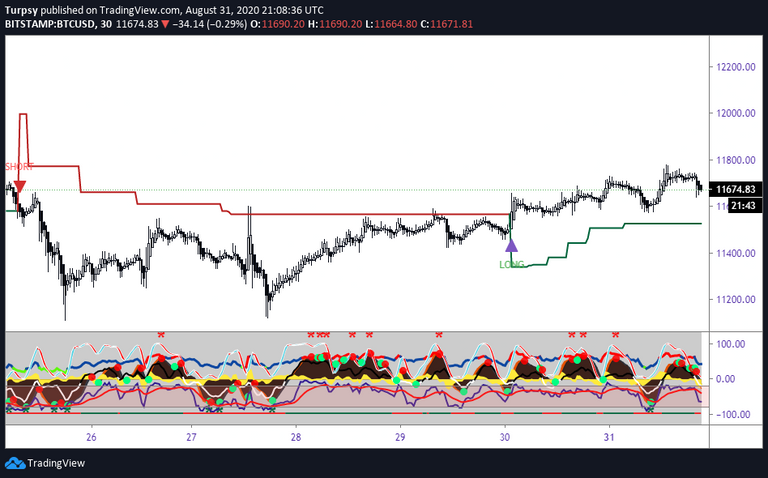
30 mins
Also, in this chart and TF, we have ST as long with support at around 11500. This means we may see a bounce and a support at that level. It will be good to look to trade that support. We know that we buy at support and sell at resistance. Willy is also resetting to oversold level. We also can see the red dot on the wavetrend. This shows we can trade the next drop.
https://www.tradingview.com/x/CWwTv45U/
Extras
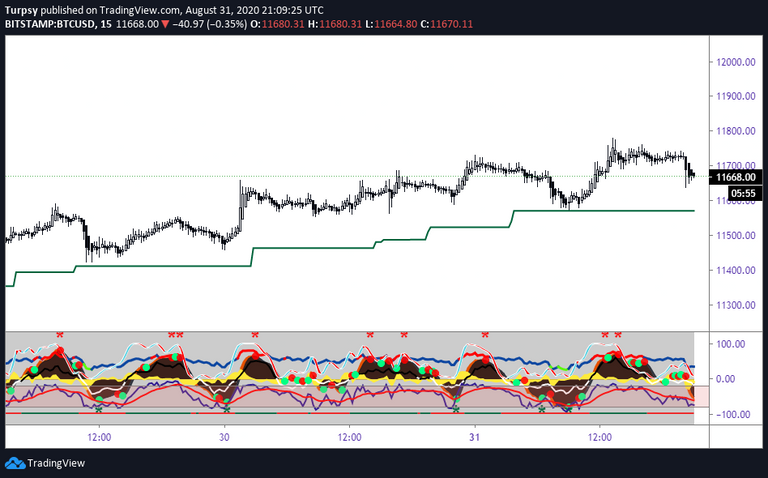
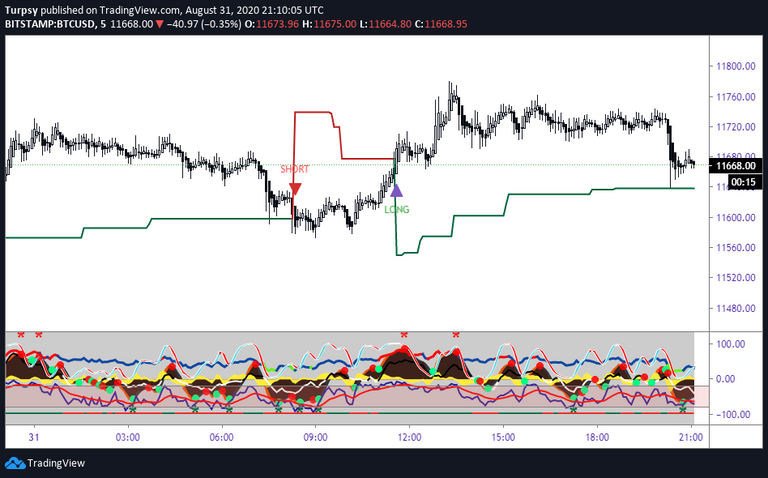
15mins and 5 mins charts respectively.
https://www.tradingview.com/x/TzmZKb6W/
https://www.tradingview.com/x/6CwAxkFR/
Summary:
4hrs ST is long
1hr ST is long
30 mins ST is long
My Position
Today, I think we should long trade the next drop
This is what I wrote the last time. I look forward to taking a position soon
I will be looking for a long if the 4hr is not closing below the 11111 USD.
Congratulations, your post has been curated by @r2cornell-curate. Also, find us on Discord
Felicitaciones, su publication ha sido votado por @r2cornell. También, encuéntranos en Discord