As the RSI indicator assessed in my dedicated post, Bollinger Bands is another Technical Indicators that used to help us in order to identify "Overbought" or "Oversold" Conditions in the market.
As usual, surfing in the web you can find a lot of trading strategies following this indicator as the main but, There is not so much information about how efficient it could be.
I personally don't base my trading strategies in one indicator but mostly in the combination of some of them together with my Elliot Waves count which, in my opinion, it is the best theory to apply when trading.
However, and putting aside why I prefer Elliot Waves in top of any other tool, I am interested to understand how efficient could be the use of the "Bollinger Band" Indicator as unique signal in order to BUY/SELL the whole position in play as I did with the RSI.
A Bollinger Band is composed basically by three lines:
- The middle line is the Simple Moving Average of the price during a particular period of time, use to be 20
- Upper and Lower lines is the spread of the price based on the Standard Deviation.
What I want to check is the typical strategy based on "Bollinger Band Bounce",
...on which a position is BOUGHT/SOLD when the price exactly crosses either the lower or the Upper line.
Basically, I had a look on the price moving within the Bollinger Band, starting with an hypothetical investment of 1000 USD and BUY BTC exactly at the moment the price crosses the Lower Band, and then sell at the moment it crosses the upper Band. This "game" is kept during the whole interval of time so, if I buy BTC the next action can only be to SELL the whole BTC batch and then to BUY...etc...
I started my assessment having a look to the 1-Day Chart
I found the following "Indications" since July 2019 till the present, which is the maximum span of the time I can watch on the screen in this time-frame:
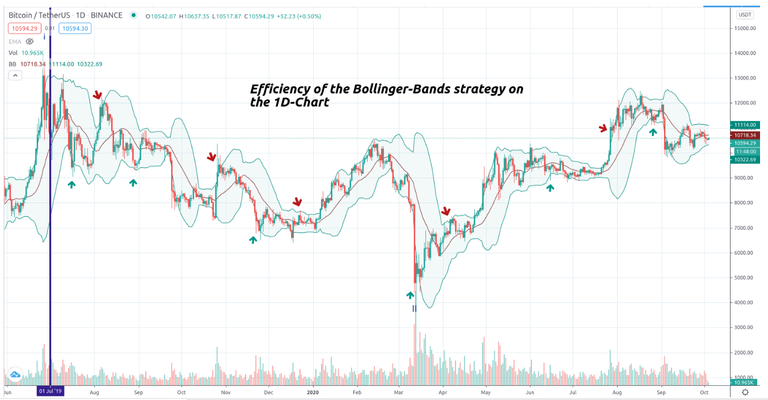
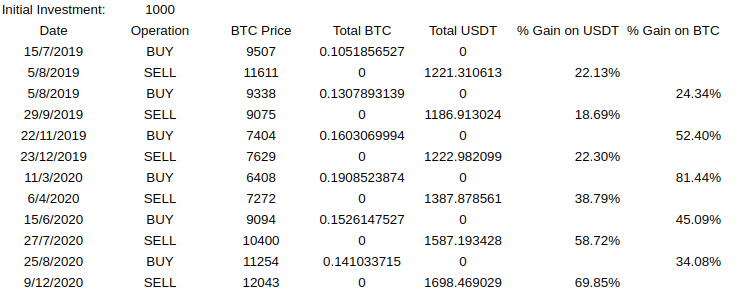
The numbers have been the following:
Putting the "Gains" in a chart:
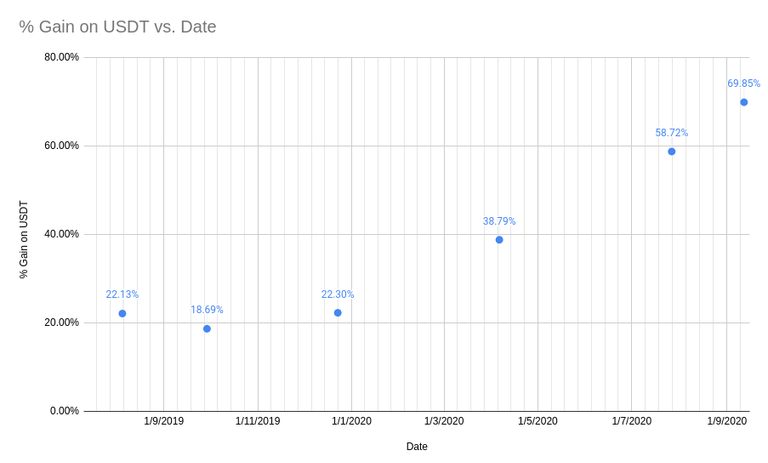
As you can see, from the initial investment, 1000 USD, after 9 moths of "running" this strategy we should have managed to get 1698 USD or 69.8% Profit... which is not bad for a "Passive Income" of an automatic process.
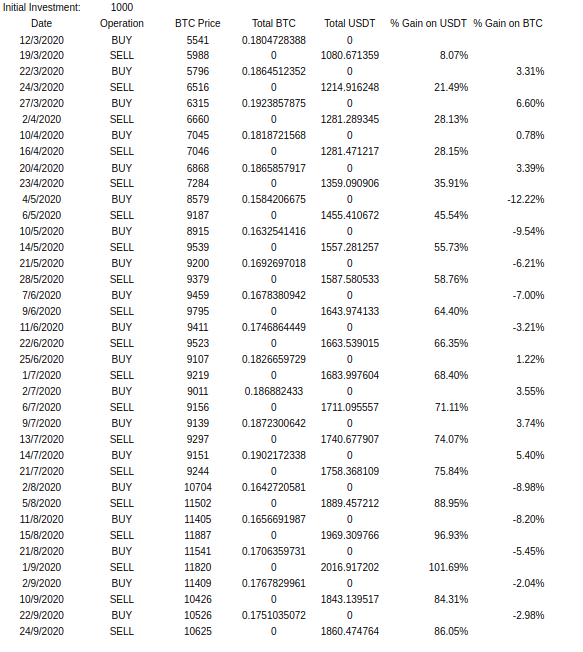
However, on the 4h-Chart the situation becomes more interesting
Lots more of indications obviously in a smaller interval of time, ie since March 2020 till the present.
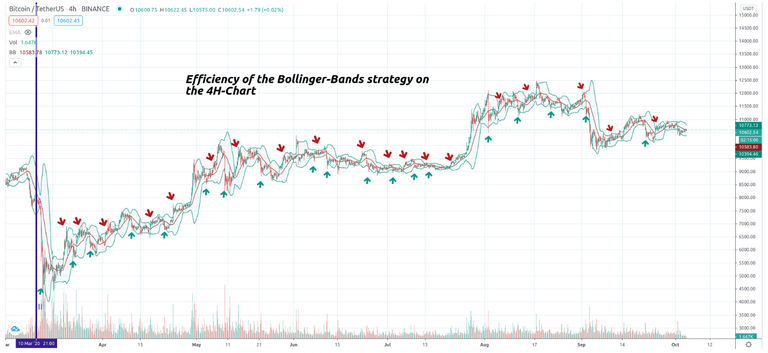
With the following numbers...
Tracing "Gains" in a chart:
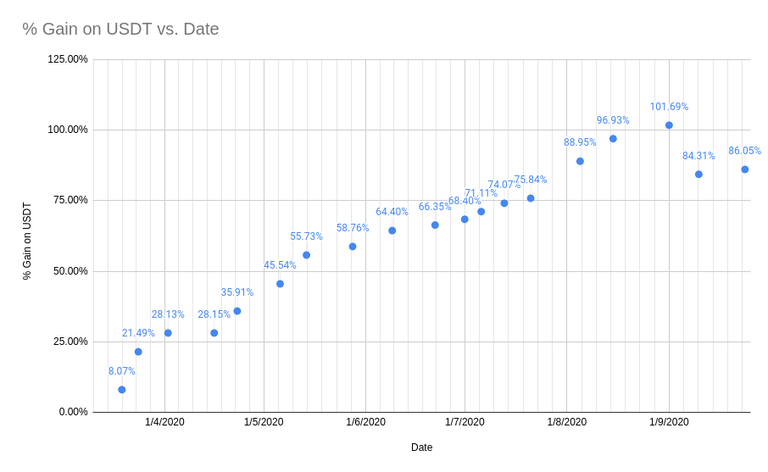
86% profit in 6 months.
Comparing Bollinger and RSI strategies
My assessment on the RSI indicator was done only on the 4h Chart timeframe since the daily does not have so many signals.
Both indicators provided with profits during the same interval of time but, the ACTUAL WINNER has been the BOLLINGER BAND strategy since RSI get 51.6% Gains.
Actually, BOLLINGER BANDS indicates oversold and Overbought conditions more often than RSI so, seems to be more related with the volatility of the price, in such a manner, there are more trades in the same interval of time than the ones provided by the RSI.
However, independently of the "game" I tried to simulate while having a look on the historical data, RSI has another quality that makes it better to be used by traders and it is the ability of indicating DIVERGENCES on the chart much better than the Bollinger Bands.
The use of DIVERGENCES between price action and RSI is really a very powerful weapon but this is another story to explain maybe in the future...
Hope you have enjoy it.
Other Related Posts:
- Candlestick Patterns: How efficient is the Bullish Engulfing Pattern on BTC trading?
- Candlestick Patterns: How efficient is the Bullish Hammer Candlestick on BTC trading?
- Candlestick Patterns: How efficient is the "Inverted Hammer" Candlestick on BTC trading?
- Efficiency of the RSI indicator as unique trading tool on BTC/USDT pair
I'm sharing only my quick trading Ideas here, not financial advice at all ;-)
*Disclaimer: This is just my personal point of view, please, do your own assessment and act consequently. Neither this post nor myself is responsible of any of your profit/losses obtained as a result of this information.