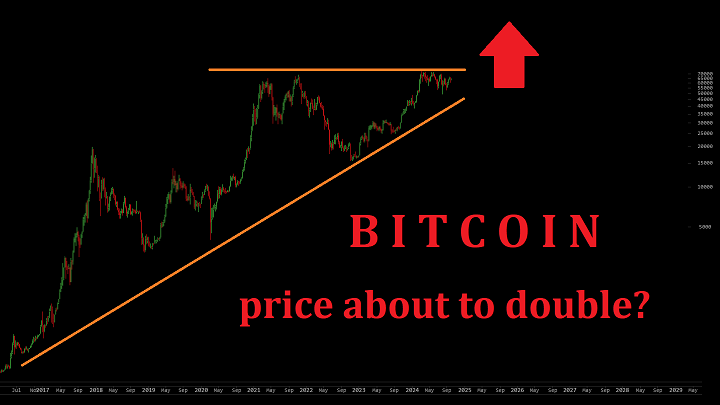
BTC is $10k below its all-time high, achieved 7 months ago. Since then, it has traded mainly between $55k and $70k, refusing to correct deeply, yet struggling to make new highs. Many are asking "Is the bull market over already?", but if history is any guide, we are just days away from a massive price surge over $100,000 USD.
Background
In late October 2016, the price of BTC began a sharp upward drive which multiplied the price by more than 20.
In late October 2020, the price of BTC began a sharp upward drive which multiplied the price by 7.
In late October 2024, I expect the price of BTC to begin a sharp upward drive which will multiply the price by 2 or 3.
In each of the previous cases - which was repeated in 2012 as well, but I don't have a good chart for that - it took just over a year to reach the peak of the bull market. I expect the current bull market to hits its highs in late 2025.
Here is a chart showing the daily candles back to the start of this year:
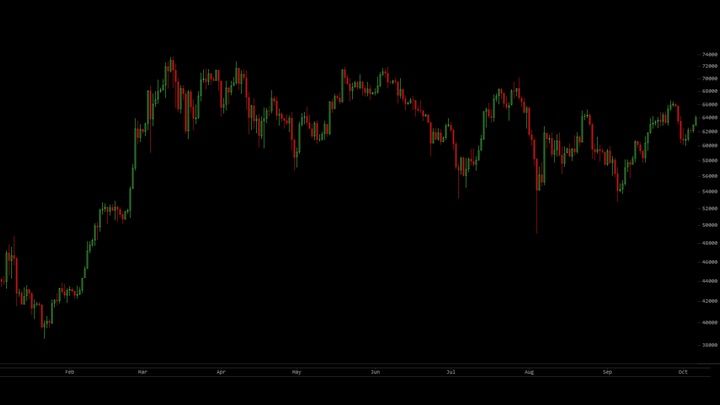
After the move up, it has been a long and painful sideways consolidation. With a brief plunge to $50k a few months ago, it's beginning to look like another cup formation, which typically leads to a breakout once the pattern completes. But for now, we're grinding sideways, with each test of support met by rejection.
Zooming out to see the whole bull market starting at $15k, here's a chart where each candle represents 3 days:
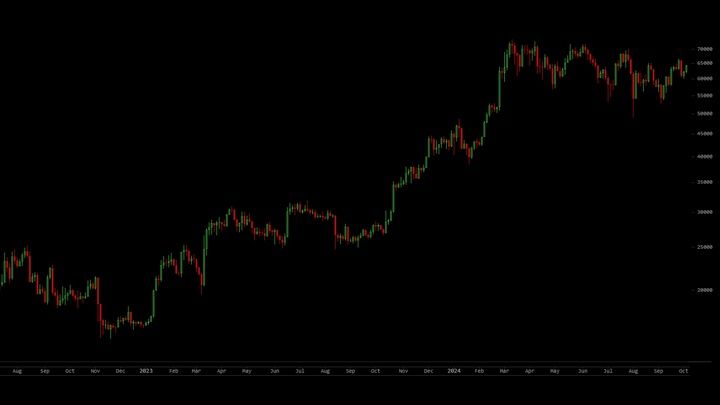
You can really see the current period of consolidation in that view. No sign of a bear market at this point, but the sideways action has become disheartening to many, leading to them asking if the bull market is over.
History shows the BTC price moves in 4 year cycles, so we need to zoom further out. This chart shows weekly candles and goes back almost 10 years:
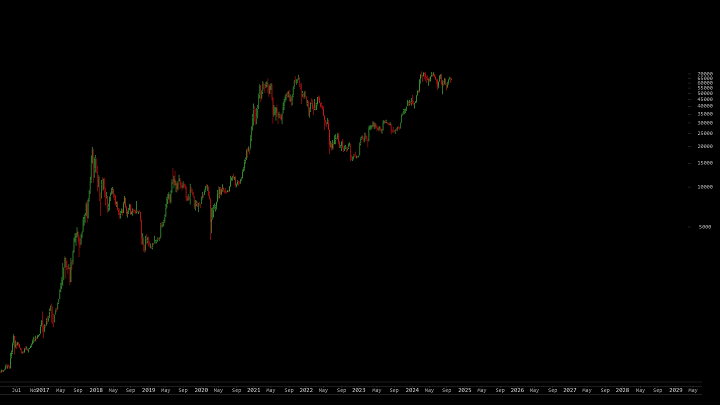
We've yet to break out from the highs of the LAST bull market! This one's nowhere near over.
For proof, let's draw in a vertical blue line every 4 years:
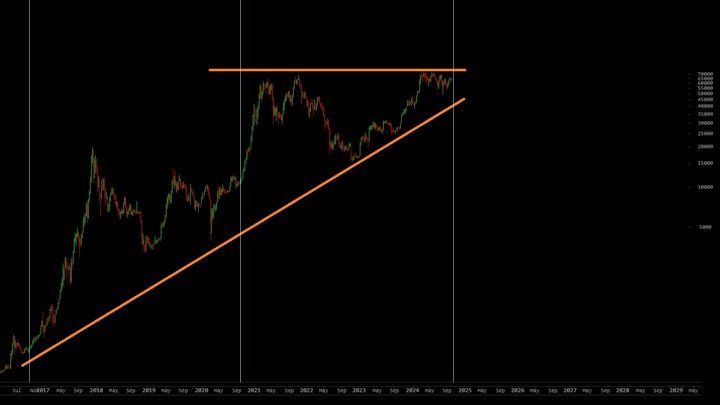
Every 4 years in late October, the price suddenly spikes. It could begin any day now. There wouldn't be any warning this time, just as there wasn't any warning last time. The price will be languishing, or even correcting, and then suddenly it begins to rise... and climb... and pump! It feels like we're right at that moment again, and most people are sleeping through it again.
Note that I also drew in some orange trend lines. That's quite the ascending wedge. Insanely bullish, and coming to a breakout point very soon.
All indicators point to a massive swell in crypto prices over the next 12 to 14 months. What might the chart look like?
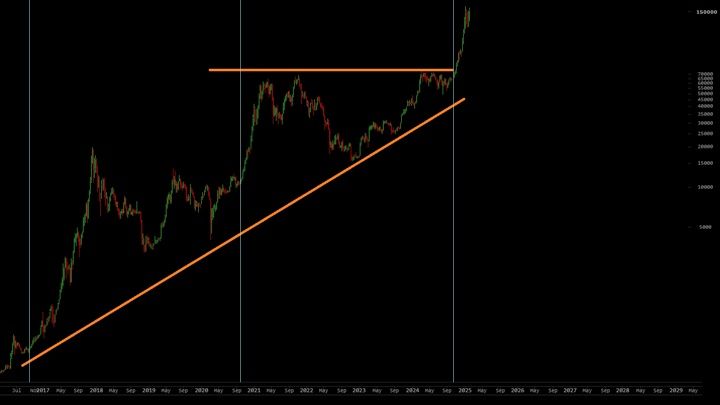
Gauging by past performance, it could go something like that - $150,000 by the first half of 2025. A spike to $200k by the end of the year is entirely possible. Gains in the alt-coins are likely to be monstrous.
Late October, every 4 years. We're days away.
Hang on to your hats. (And your sats!)
DRutter

Re🤬eD
🥓