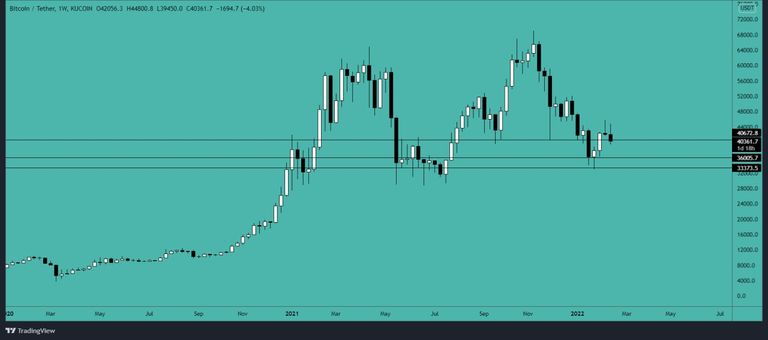
BTC on Weekly chart, hovering over the weekly support area around $40,600 and $36,000. Price just playing off the zones which are made on LTF. We can continue to see the moves unless fundamental are not cleared. You can lower the risk in trade until that. Weekly needs breaks and close above $52,000 but on daily, price need only $46,000 to turn the market bullish.