Today’s on-chain analysis from BeInCrypto looks at indicators of the behavior of long- and short-term Bitcoin holders, the amount of supply they hold and the amount of (il)liquid BTC in circulation. The on-chain data shows that the market is at the end of the accumulation phase, which has historically been followed by increases in the Bitcoin price.
Long-Term Holders Start Selling
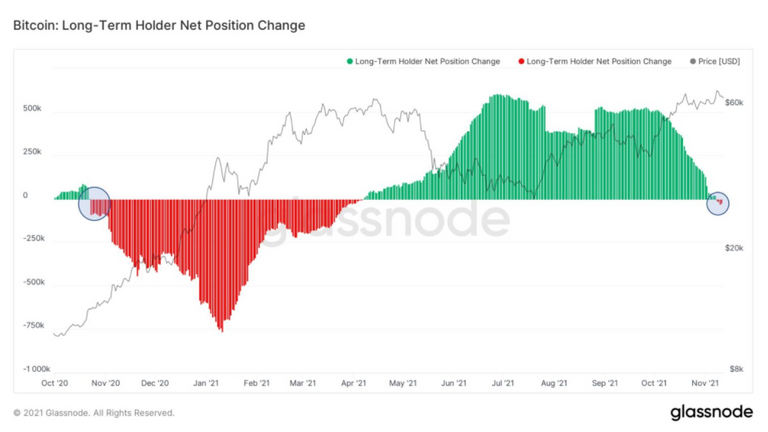
The Long-Term Holder Net Position Change indicator measures the change in Bitcoin supply that remains in the hands of long-term holders (LTH). These are those addresses that hold BTC for at least 155 days (about 5 months).
Historically, we mostly observe a negative correlation between the BTC price and the LTH position change indicator. If holders are buying up BTC, the price usually goes down. If they sell, the price typically goes up. This is because LTHs sell Bitcoin to short-term holders (STHs). The latter typically buy on the upside and sell on the downside. LTHs do the opposite.
It turns out that in the first half of November, the Long-Term Holder Net Position Change indicator generated its first negative bars since April 2021 (blue circle on the right). At that time, Bitcoin was completing its rally to the historic ATH at $64,800. This was followed by a correction of more than 55%, which took the price to the $29,000 level in July. That’s when the green LTHs position bars peaked – holders were definitely buying the dips.
Long-Term Holder Net Position Change / Source: Twitter
Currently, the situation is reversing and more LTHs are starting to sell. The last time the transition from green to red bars occurred was in mid-October 2020 (blue circle on the left). At that time, Bitcoin broke through resistance at $12,500 and started the first exponential bull market phase. It led to an increase of 417% in just 6 months.
Well-known on-chain analyst @WClementeIII commented on Twitter on the event as follows:
“We’ve just gotten our first red prints on LTH net position change in over 6 months, showing bull market distribution has begun.”
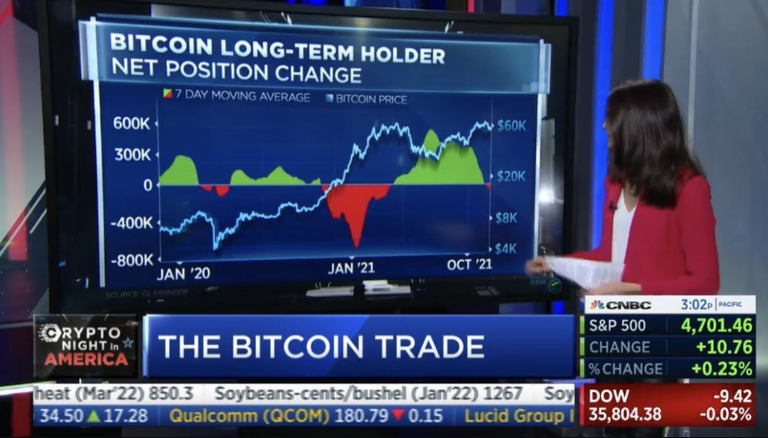
Interestingly, the event was significant enough to be featured in a report by CNBC, one of the largest business TV stations in the world. Another on-chain analyst @DylanLeClair_ posted a screenshot of the CNBC report, commenting “it’s about time”.
Source: Twitter
Extreme values of STH and LTH supply
The significance of the ongoing trend change within the Long-Term Holder Net Position Change indicator stays in confluence with the on-chain data about supply in the hands of STHs and LTHs. For it appears that they are just now reaching the extremes that are typical of the bear market endings that precede a bull market.
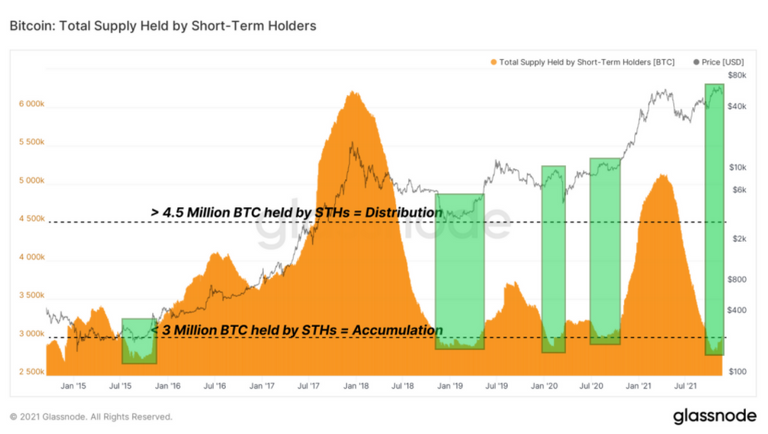
The last chart included in the latest weekly on-chain report from Glassnode illustrates the Total Supply Held by Short-Term Holders indicator. It turns out that supply held by STHs is reaching areas of bear markets that were the last buying opportunities before major bull markets (green zones).
Total Supply Held by Short-Term Holders / Source: insights.glassnode.com
Values below 3 million BTC indicate a period of accumulation, as the majority of Bitcoin in circulation moves into the hands of LTH. Bitcoin is preparing for a rally. Values above 4.5 million BTC are a signal for distribution, as most of LTHs sell to STHs. Bitcoin ends the uptrend and prepares for the fall.
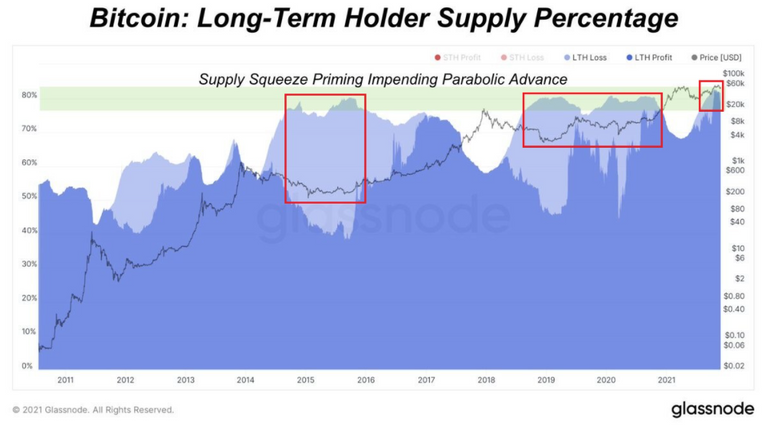
This chart remains in line with the Long-Term Holder Supply Percentage indicator, which, having already reached above 80%, is today in the region of its ATH (green area). When this area was filled by LTH positions in loss (light blue color), it was a signal of the end of a bear market. On the other hand, when it was filled by LTH positions in profit (dark blue color), we were dealing with an exponential growth phase.
Long-Term Holder Supply / Source: Twitter
Since the correction in May and reaching the lows in July 2021, LTH positions have been growing rapidly. Today, LTHs hold the majority of Bitcoin in circulation and their positions are in clear profit. It signals strong BTC accumulation, its low liquidity and readiness for the next phase of a long-term bull market.
Extreme illiquidity of BTC
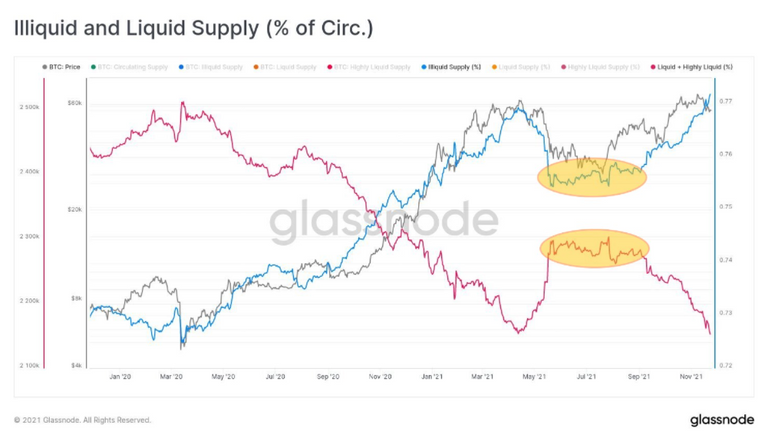
An additional argument of on-chain analysis to confirm the critical position that Bitcoin is in today is the comparative Illiquid and Liquid Supply chart. This is the amount of illiquid, liquid and highly liquid BTC that is in circulation.
Illiquid and Liquid Supply / Source: Twitter
The current amount of illiquid Bitcoin (blue line) is at its ATH today. This remains in line with record levels of BTC supply in the hands of long-term holders who are not eager to sell.
At the same time, the sum of liquid and highly liquid Bitcoin (red line) is at a long-term low today. Moreover, it is also collapsing below the April 2021 low, when the Bitcoin price reached historic ATH.
The fall of illiquid and the rise of liquid supply last took place during the summer correction (orange circles). Since then, the charts have been moving away from each other again and continuing a trend leading to a dramatic reduction in the supply of BTC in circulation.
For BeInCrypto’s latest Bitcoin (BTC) analysis, click here.
Disclaimer
All the information contained on our website is published in good faith and for general information purposes only. Any action the reader takes upon the information found on our website is strictly at their own risk.

