
Bitcoin (BTC) increased during the week of Aug 30-Sept 5, starting the week at $48,767 and reaching a close of $51,900.
While technical indicators provide mixed signals, BTC is still well above the $51,200 horizontal resistance area.
Long-term BTC outlook
BTC opened on Aug 30 at a price of $48,767. It increases steadily during the week, creating a bullish candlestick and reaching a close of $51,900.
Despite the upward move, the weekly chart is not yet bullish.
BTC has yet to reclaim the ascending support line from which it broke down from. Previously, the line had been in place since March 2020. BTC is still in the process of validating the line as resistance (red icon). Furthermore, the resistance is strengthened by the supertrend line.
However, both the RSI and MACD provide a bullish reading. The former has moved above the 50-line, while the latter’s signal line is positive. In addition to this, the histogram has given a bullish reversal signal.
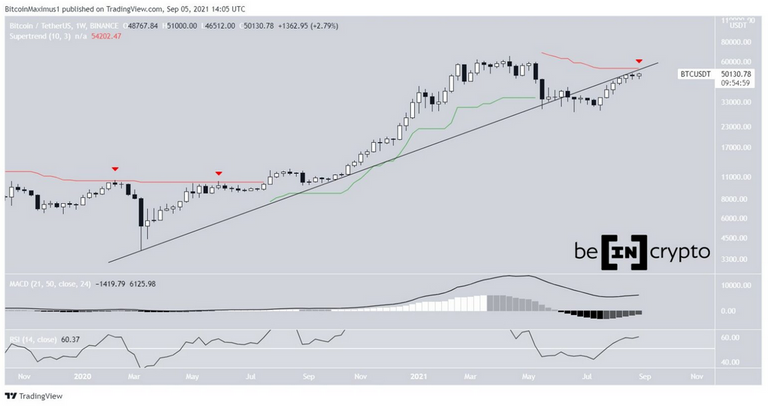
BTC Chart By TradingView
Current resistance
Technical indicators in the daily time frame for BTC provide a mixed outlook.
Since Aug 13, both the RSI and MACD have generated considerable bearish divergences. The RSI has also reached its bearish divergence line.
However, the MACD has finally generated a higher momentum bar. Furthermore, the supertrend is bullish.
While technical indicators are mixed, the price action is bullish. Firstly, the Sept 3 close was the highest since May and the Sept 5 close was even higher. The latter caused BTC to finally move above the $51,200 resistance area, which is the 0.618 Fib retracement resistance level and a horizontal resistance area. The next closest resistance area is found at $51,800.
It’s worth noting that the breakout transpired with insignificant volume (red icon).
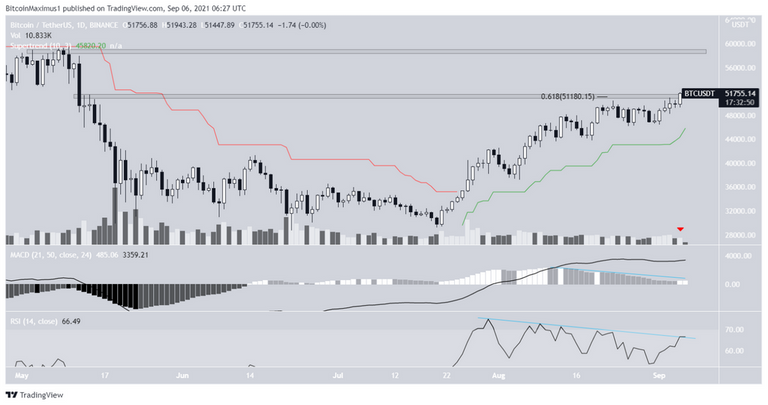
BTC Chart By TradingView
Future movement
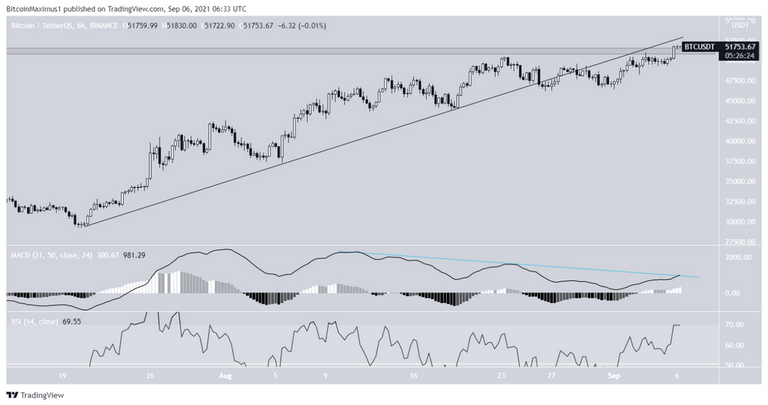
Similar to the weekly timeframe, the six-hour chart shows that BTC broke down from an ascending support line.
It’s currently approaching the line, potentially validating it as resistance. Also, similar to the daily time frame RSI, the MACD has reached its bearish divergence line.
Furthermore, the ascending support line somewhat coincides with the $51,200 horizontal resistance area, being just slightly above it.
Therefore, while the breakout is not yet confirmed, it seems that BTC is likely to head upwards, at least in the short term.
For BeInCrypto’s previous Bitcoin (BTC) analysis, click here.