ChainLink (LINK) is trying to hold on to its bullish structure in order to eventually make another breakout attempt.
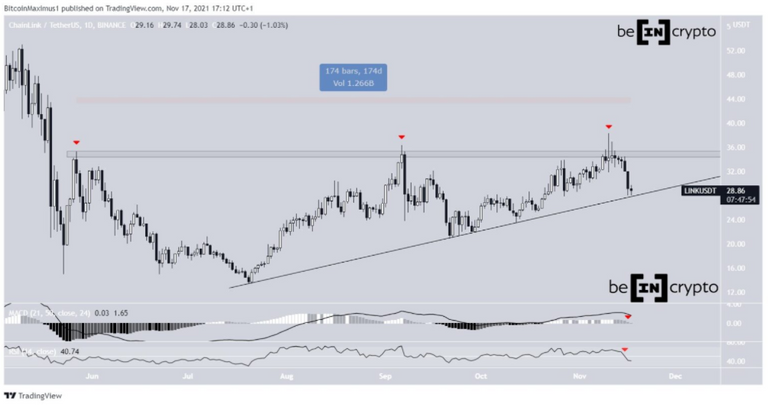
LINK has been increasing alongside an ascending support line since reaching a low of $13.38 on July 20. The upward movement led to a high of $36.33 on Sept 6 and a slightly higher high of $38.31 on Nov 10.
However, both times, LINK was rejected by the $35 horizontal resistance area and fell. The resistance has been in place since May 27, for a total of 174 days. So far, it rejected the token thrice (red icons).
After the rejection, LINK returned to the ascending support line once more.
While the fact that it is reacting to the line is a bullish sign, technical indicators are showing signs of weakness.
The MACD, which is created by a short- and a long-term moving average (MA), is moving downwards and is nearly negative. This means that the short-term MA is moving at a slower rate than the long-term one, and is considered a bearish sign.
Similarly, the RSI, which is a momentum indicator, has fallen below 50. This is also considered a bearish sign and is associated with downward trends.
As a result, whether LINK bounces or breaks down from the line is crucial in determining the direction of the trend.
Chart By TradingView
Will LINK break down?
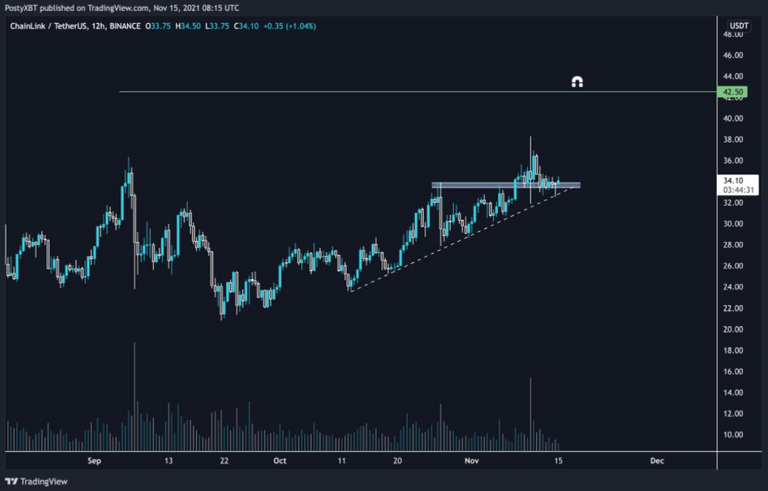
Cryptocurrency trader @PostyXBT outlined a LINK chart, stating that the token could potentially increase all the way to $42.50.
Source: Twitter
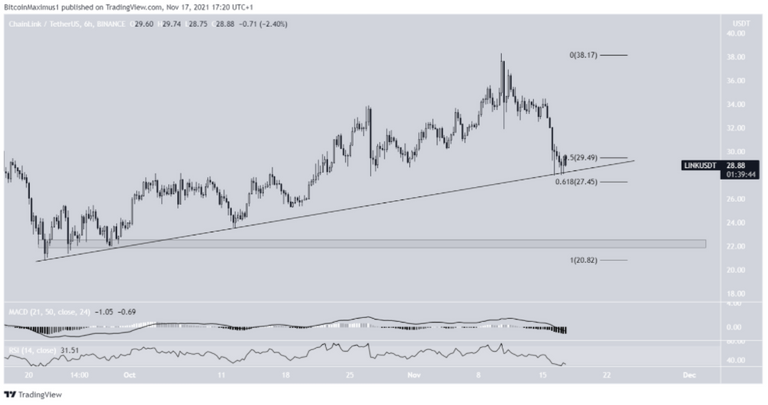
While the token has decreased slightly since the tweet, it is still following the ascending support line. While this is a shorter-term ascending support line, its slope currently coincides with the longer-term one previously outlined.
However, similarly to the daily time-frame, both the MACD and RSI are moving downwards and are in negative territory. This supports the possibility that LINK will break down in the short-term.
Since the line is between the 0.5 and 0.618 Fib retracement support levels, a breakdown from it would take LINK towards the lows at $22.
However, until the lines are in place, the bullish structure remains intact.
Chart By TradingView
For BeInCrypto’s latest Bitcoin (BTC) analysis, click here.
Disclaimer
All the information contained on our website is published in good faith and for general information purposes only. Any action the reader takes upon the information found on our website is strictly at their own risk.


Thank you for using my upvote tool 🙂

Your post has been upvoted (1.18 %)
Delegate more BP for better support and daily BLURT reward 😉
@tomoyan
https://blurtblock.herokuapp.com/blurt/upvote