
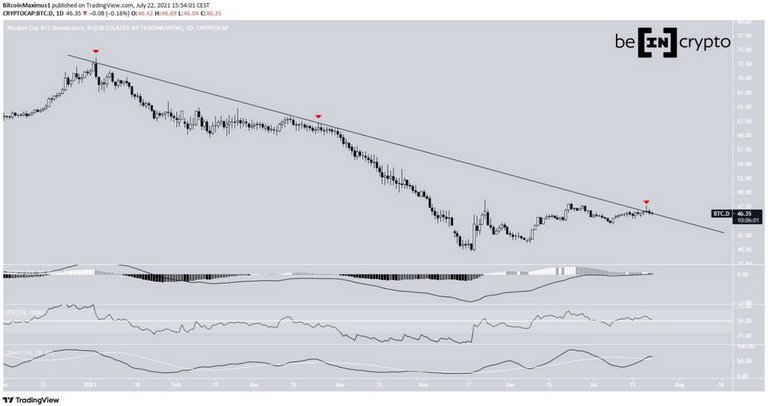
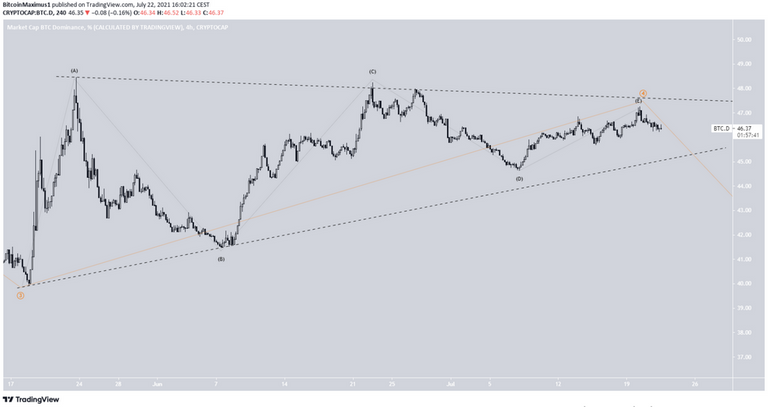
The Bitcoin dominance rate (BTCD) has been following a descending resistance line since January and was rejected by it on July 20.
It is possible that BTCD has reached a local top and will soon break down from its short-term pattern.
Descending resistance line
Since January, BTCD has been decreasing alongside a descending resistance line. It has been rejected by it thrice (red icons), most recently on July 20.
Technical indicators in the daily time-frame are relatively neutral. The MACD has lost its strength and is trading exactly at the 0 line. The RSI is slightly above 50, and while the Stochastic oscillator has made a bullish cross, it has also generated bearish divergence.
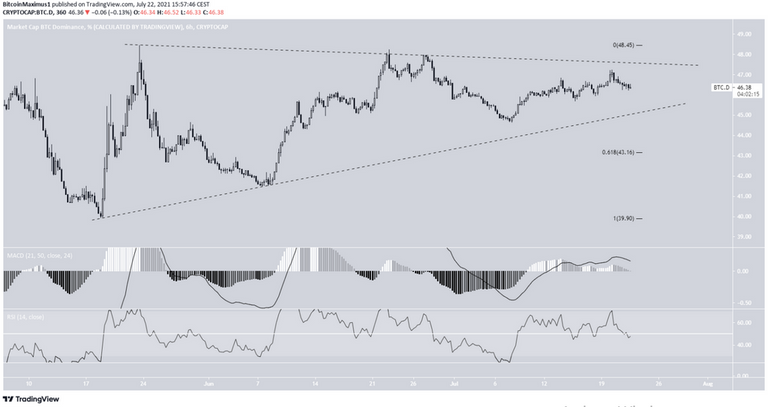
Symmetrical triangle
The shorter-term six-hour chart shows that BTCD is also trading inside a symmetrical triangle. It is approaching the point of convergence between resistance and support. Therefore, a breakout/down from the pattern is eventually expected.
Due to the readings from the daily time-frame, a breakdown would be more likely.
While the short-term RSI is neutral, the MACD is bearish and has given a bearish reversal signal.
If a breakdown occurs, the closest support would be at 43%, the 0.618 Fib retracement support level.
Wave count
Cryptocurrency trader @Altstreetbet outlined a BTCD chart, stating that another wave down towards a new all-time low is likely.
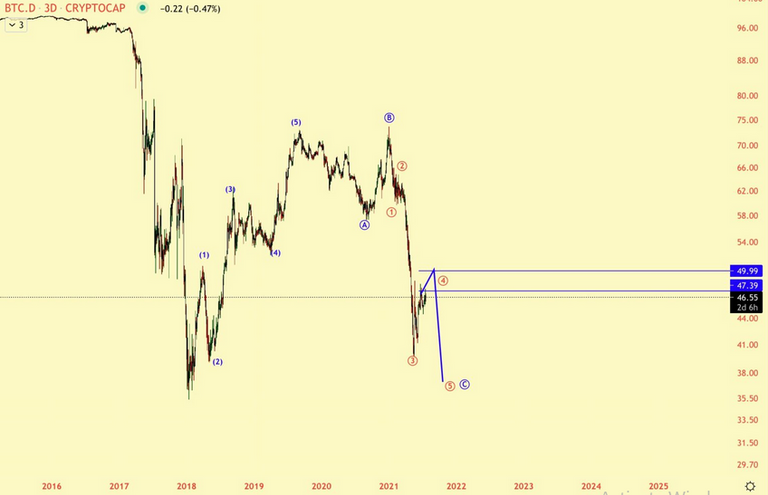
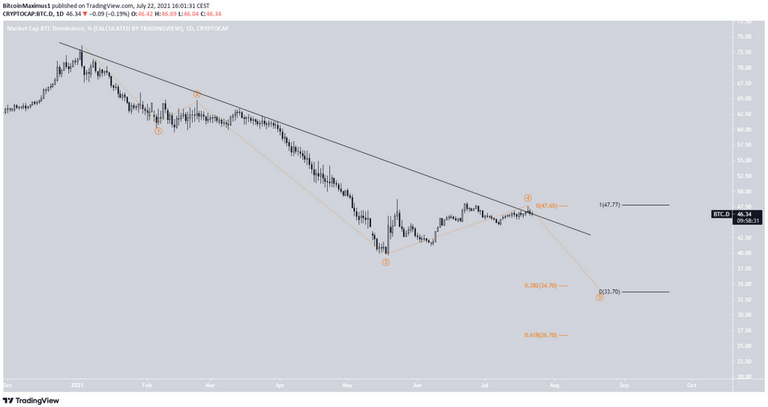
The most likely wave count indicates that BTCD has just completed wave four of a bearish impulse (orange).
The most likely target for the low of the entire movement is between 33.7-34.7%. The target is created by using a Fib projection on waves 1-3 (orange), and by using the length of wave 1 (black).
The shorter-term 4-hour chart shows that wave four took the shape of a symmetrical triangle.
BTCD has just completed sub-wave E and could break down in the near future.
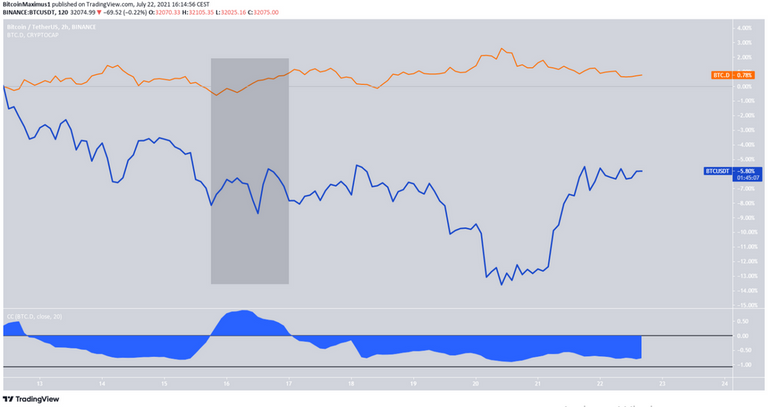
Relationship to BTC
With the exception of July 15-16, BTCD (orange) has had a negative relationship with BTC (blue) since July 12. This means that an increase in the price of BTC has caused a drop in BTCD.
This is also visible by the correlation coefficient, which is very close to -1, indicating a nearly perfect negative relationship.
If the relationship holds, a continued increase in the BTC price would be required in order for BTCD to fall to the given target.
For BeInCrypto’s latest bitcoin (BTC) analysis, click here.