Basic Attention Token (BAT) is decreasing in the short-term, attempting to find support before eventually resuming its upward movement.
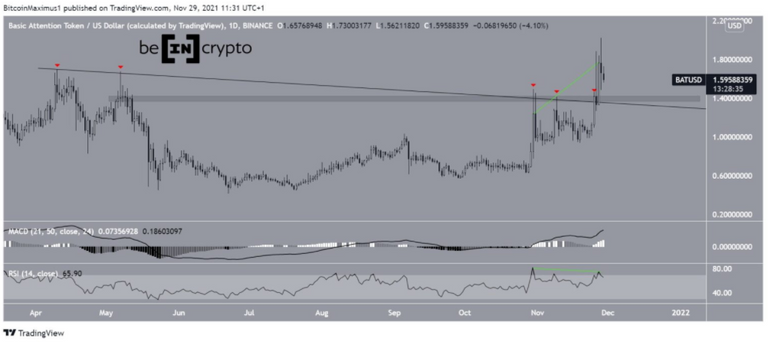
BAT had been decreasing underneath a descending resistance line since April 10, when it had reached a then all-time high price of $1.69. It was rejected by the line for the fifth time (red icon) on Nov 25.
However, BAT broke out the next day and proceeded to reach a new all-time high price of $2.02 on Nov 28.
Even though BAT has been decreasing since then, technical indicators are still bullish.
The MACD, which is created by short and long-term moving averages (MA), is positive. This means that the short-term MA is moving faster than the long-term average. This indicator is a staple of bullish trends.
While the RSI has generated a bearish divergence (green line), it’s still above 70, which also indicates that the trend is bullish.
If the decrease continues in the short term, the $1.40 area is expected to act as support.
Chart By TradingView
Short-term movement
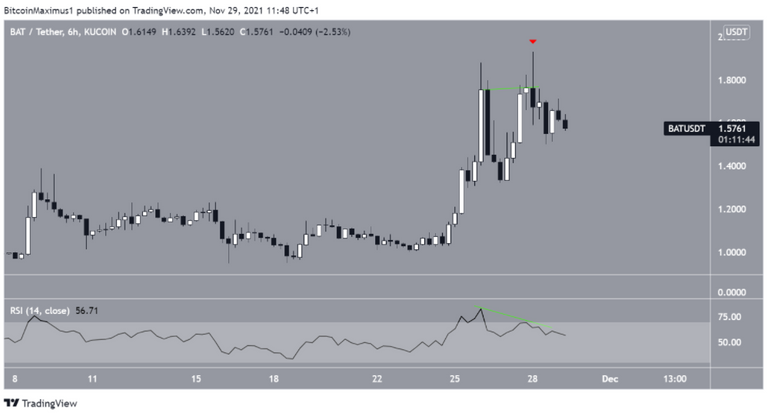
The six-hour chart suggests that BAT will decrease at least to the $1.40 support area. It has created a double top, which is considered a bearish pattern, meaning that a decrease would be expected to follow.
In addition to this, the price created a long upper wick (red icon), a sign of selling pressure, and the RSI generated a bearish divergence.
Therefore, a short-term downward move would be likely.
Chart By TradingView
BAT wave count
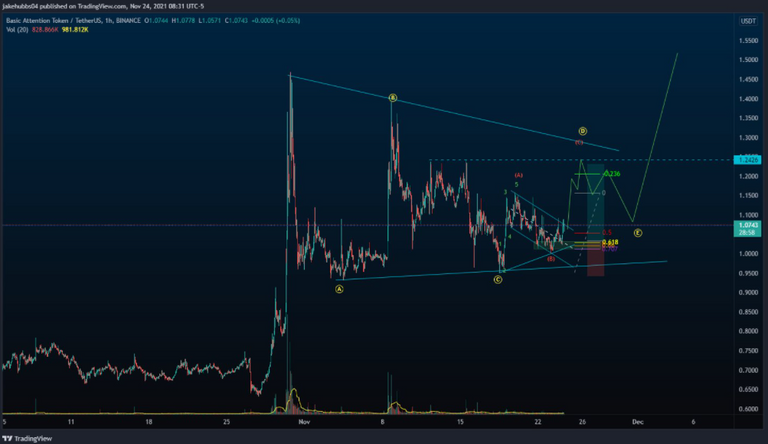
Cryptocurrency trader @Thetradinghubb outlined a BAT chart, stating that it’s likely to increase towards at least $1.25.
Source: Twitter
Since the tweet, BAT has moved above the target and proceeded to reach a new all-time high price on Nov 28.
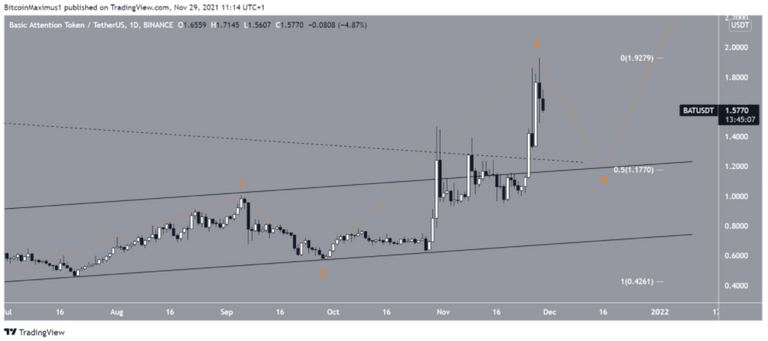
BAT seems to be in wave four of a five-wave upward move. Wave four is corrective, meaning that BAT is likely to move downwards until it completes this phase.
There is considerable support near $1.80 created by:
- 0.5 Fib retracement support level
- Previous descending resistance line
- Previous ascending parallel channel
A decrease to the $1.80 level would also complete a fourth wave pullback, an occurrence in which wave four is completed in a sharp fall prior to the continuation of the upward move.
After this, another increase would be likely to complete the fifth and final wave.
BAT Chart By TradingView
For BeInCrypto’s latest Bitcoin (BTC) analysis, click here.
Disclaimer
All the information contained on our website is published in good faith and for general information purposes only. Any action the reader takes upon the information found on our website is strictly at their own risk.


